The water-dependent asset register for the Maranoa-Balonne-Condamine subregion (Bioregional Assessment Programme, 2017) contains 310 economic assets comprising 10,825 elements (Table 31). This includes:
- 183 assets in the ‘Surface water management zone or area’ subgroup, comprising
- 145 water access rights, comprising 781 elements, including the spatial location of surface water licenses and extraction works, such as from the Dawson River or Dogwood Creek water sources
- 32 basic water rights (stock and domestic), comprising 48 elements, including the spatial location of approved extraction works, such as from the Moonie River or Myall Creek water sources
- 6 water supply and monitoring infrastructure assets that include dams and weirs, such as the Clarendon Dam and Buckinbah Weir
- 127 assets in the ‘Groundwater management zone or area’ subgroup, comprising
- 76 water access rights, containing 5567 elements or individual bores in a groundwater management zone or area, such as Oakey Creek or Surat East groundwater management areas
- 38 basic water access rights (stock and domestic), containing 4410 elements, including 4401 individual bores that do not require a licence for the extraction of groundwater and 9 groundwater management plan areas in NSW
- 13 water supply and monitoring infrastructure assets, such as Crows Nest and Toowoomba borefields.
Potential impacts due to additional coal resource development are contained in the zone of potential hydrological change, where there is a greater than 5% chance of exceeding 0.2 m drawdown due to additional coal resource development in the source aquifer (Figure 42). For economic assets in the ‘Surface water management zone or area’ subgroup, the zone is represented at the surface and for assets in the ‘Groundwater management zone or area’ subgroup, the zone is represented in the relevant geological layer from which assets source water. Water-dependent assets outside of this zone are very unlikely to be impacted by hydrological changes due to additional coal resource development.
Potential impacts to groundwater economic assets in the Maranoa-Balonne-Condamine subregion are assessed and reported for two separate datasets:
- 9,990 individual bores included in the water-dependent asset register (Bioregional Assessment Programme, Dataset 2; Bioregional Assessment Programme, 2017)
- 21,192 individual bores reported in the Underground water impact report for the Surat Cumulative Management Area (QWC, 2012) (Bioregional Assessment Programme, Dataset 9). This dataset includes the assigned aquifer and formation, estimated usage, depth and purpose of each bore. Estimates of groundwater extraction from these bores is described in companion product 1.5 for the Maranoa-Balonne-Condamine subregion (Cassel et al., 2015). Potential impacts to these bores are reported in companion product 2.6.2 (Janardhanan et al., 2016).
Table 31 Number of economic water-dependent elements and assets in the assessment extent and zone of potential hydrological change
Data: Bioregional Assessment Programme (Dataset 2)
One of the 183 assets in the ‘Surface water management zone or area’ subgroup potentially experiences hydrological change due to additional coal resource development. This asset is the surface water extraction point for a licensed water access right in the headwaters of Downfall Creek in the vicinity of The Range coal mine. As surface water modelling was not carried out in this Assessment, the potential impacts to this water access right were not further assessed.
The zone of potential hydrological change in the relevant geological layer includes 13 of the 127 assets in the ‘Groundwater management zone or area’ subgroup (Table 31 and Figure 42). This includes 163 individual bores contained in:
- 7 water access rights, including 117 individual bores and associated licences that are managed by Queensland’s ‘Condamine and Balonne’ and ‘Great Artesian Basin’ water resource management plans
- 6 basic water access rights (stock and domestic), including 46 individual bores that do not require a licence for the extraction of groundwater.
No water supply and monitoring infrastructure assets associated with either a surface water or groundwater management zone or area are located in the relevant zone of potential hydrological change and are therefore unlikely to be affected by hydrological changes associated with coal resource development in the Maranoa-Balonne-Condamine subregion.
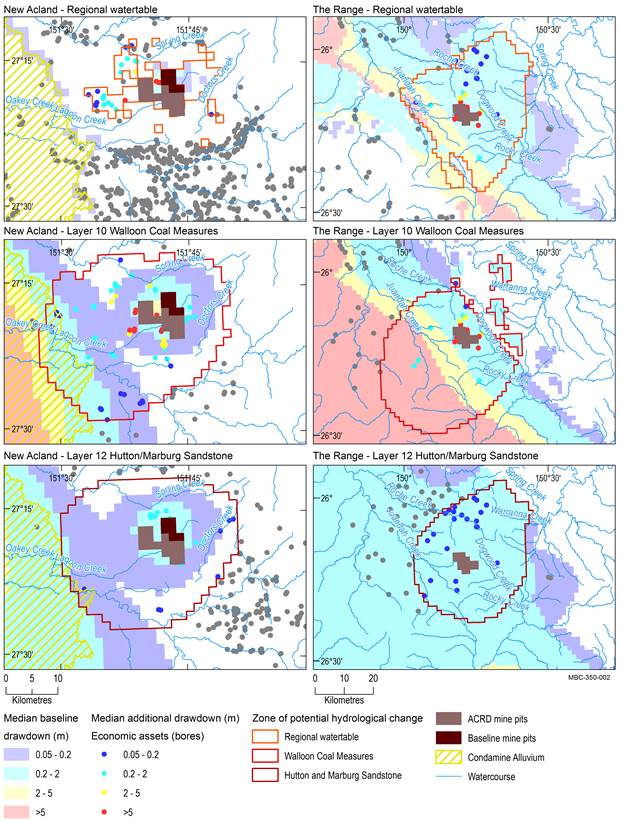
Baseline drawdown is the maximum difference in drawdown (dmax) under the baseline relative to no coal resource development. Additional drawdown is the maximum difference in drawdown (dmax) between the coal resource development pathway (CRDP) and baseline, due to additional coal resource development. The extent of the mine pits in the CRDP is the union of those in the baseline and the additional coal resource development (ACRD). Bores within modelled open-cut mine pits are not included in this analysis.
Data: Bioregional Assessment Programme (Dataset 2, Dataset 4, Dataset 5, Dataset 6, Dataset 7, Dataset 8, Dataset 10)
In Queensland, water resource plans (WRPs) are subordinate legislation under Queensland’s Water Act 2000. Surface water catchments define the areal extent of the WRPs except for the GAB WRP, which is defined by geological formations. Two WRPs partially or fully overlap the zone of potential hydrological change in the Maranoa-Balonne-Condamine subregion: the Condamine and Balonne, and the GAB plan areas. Groundwater systems managed by the Condamine and Balonne WRP include alluvial and fractured rock aquifers. The GAB WRP manages the GAB water resources by formation, described as groundwater management units.
The range of model predictions indicates that the number of bores predicted to experience additional drawdown in excess of 0.2 m ranges between 72 and 163 bores (Figure 43 and Table 32) including:
- 11 to 34 bores in the Condamine and Balonne WRP
- 61 to 129 bores in the GAB WRP, including
- 49 to 80 bores in the Eastern Downs Groundwater Management Area
- 6 to 36 bores in the Surat North Groundwater Management Area
- 6 to 13 bores in the Surat and Surat East Groundwater Management Area.
The number of bores predicted to experience additional drawdown in excess of 5 m ranges between 17 and 30 bores (Figure 43 and Table 32), including:
- 5 to 6 bores in the Condamine and Balonne WRP
- 12 to 24 bores in the GAB WRP, including
- 12 to 16 bores in the Eastern Downs Groundwater Management Area
- 0 to 5 bores in the Surat North Groundwater Management Area
- 0 to 3 bores in the Surat and Surat East Groundwater Management Area.
Nine of the 163 bores in the zone of potential hydrological change are located within the modelled open-cut mine pits (Figure 42). This includes one basic water right (stock and domestic) in the Surat East and eight water access rights in the Eastern Downs groundwater management areas in the GAB WRP.
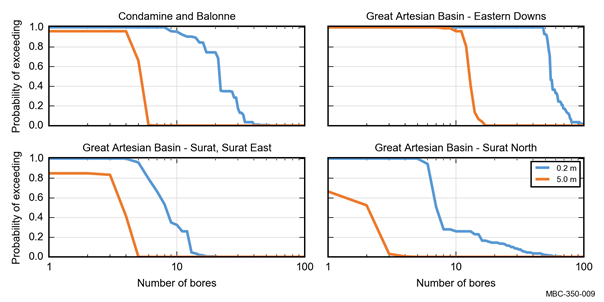
Additional drawdown is the maximum difference in drawdown (dmax) between the coal resource development pathway (CRDP) and baseline, due to additional coal resource development.
Data: Bioregional Assessment Programme (Dataset 10)
Table 32 Number of economic bores potentially exposed to additional drawdown in the relevant aquifer in the zone of potential hydrological change
aNumbers exclude the modelled open-cut mine pits.
The number of economic bores potentially exposed to ≥0.2 and ≥5 m additional drawdown is shown for the 5th, 50th and 95th percentile estimates. Additional drawdown is the maximum difference in drawdown (dmax) between the coal resource development pathway (CRDP) and baseline, due to additional coal resource development. The zone of potential hydrological change is defined as the area with a greater than 5% chance of exceeding 0.2 m drawdown due to additional coal resource development.
Data: Bioregional Assessment Programme (Dataset 10)
Not all bores in the assessment extent were included in the water-dependent asset register. Therefore, potential impacts to all non-petroleum and gas production bores identified for the Surat Cumulative Management Area (CMA) were assessed separately (Bioregional Assessment Programme, Dataset 9). Groundwater is extracted for and used for stock and domestic, agriculture, industrial and urban water use in the Surat CMA. Agricultural uses include irrigation, aquaculture, dairying, and intensive stock watering. Industrial uses include commercial and mining and water use by other industries. Urban water use is primarily for town water supplies. OGIA estimated the total non-petroleum and non-CSG water extraction in the Surat CMA as 215 GL/year from about 21,200 water bores (QWC, 2012). Around 66% of the groundwater extraction from the aquifers overlying GAB is used for agriculture. The second major use of groundwater in the alluvial and Main Range Volcanics aquifers is for stock and domestic use accounting for about 28% of the total use. Stock and domestic use accounts for the major groundwater use of the GAB aquifers at around 56%, while the use for agriculture is around 26%.
The zone of potential hydrological change in the relevant geological layer includes 501 non-petroleum and gas production bores that are located outside of the modelled mine pit cells (Table 33). The range of model predictions indicates that the number of bores predicted to experience additional drawdown in excess of 0.2 m is between 187 and 501 bores, including:
- 17 to 98 bores that access the aquifers overlying the GAB, including
- 1 to 6 bores that access the Condamine Alluvium aquifer
- 16 to 92 bores that access the Main Range Volcanics and Tertiary Volcanics aquifers
- 170 to 403 bores that access the deeper GAB aquifers, including
- 141 to 266 bores that access the Walloon Coal Measures
- 29 to 137 bores that access the Hutton and Marburg sandstone aquifer.
The number of bores predicted to experience additional drawdown in excess of 5 m ranges between 36 and 86 bores, including:
- 11 to 30 bores that access the aquifers overlying the GAB, including
- 1 to 2 bores that access the Condamine Alluvium aquifer
- 10 to 28 bores that access the Main Range Volcanics and Tertiary Volcanics aquifers
- 25 to 56 bores that access the deeper GAB aquifers, including
- 25 to 56 bores that access the Walloon Coal Measures
- 0 bores that access the Hutton and Marburg sandstone aquifer.
No bores access groundwater in the deeper Bowen Basin aquifers underlying the GAB.
Table 33 Number of non-petroleum and gas production bores in Surat Cumulative Management Areathat exceed the 5th, 50th and 95th percentile estimates of additional drawdown (m) in the zone of potential hydrological change in the relevant aquifer
aNumbers exclude modelled open-cut mine pits.
This table is modified from Table 5-1 in QWC (2012). The number of bores potentially exposed to ≥0.2 and ≥5 m additional drawdown in the relevant aquifer is shown for the 5th, 50th and 95th percentile estimates. Additional drawdown is the maximum difference in drawdown (dmax) between the coal resource development pathway (CRDP) and baseline, due to additional coal resource development. Bores within modelled open-cut pits (Table 4) are not included in this analysis.
Data: Bioregional Assessment Programme (Dataset 8)
