3.2.3.1.1 Regional watertable
This section describes the creation of a hypothetical regional watertable to represent hydrological changes in the uppermost geological layers using spatially explicit, probabilistic estimates of hydrological change predicted by the Queensland Office of Groundwater Impact Assessment (OGIA) regional groundwater model. Potential hydrological changes in the regional watertable were used to assess possible impacts on assets and ecosystems at the surface.
Impacts to water-dependent landscapes and assets are mostly caused by changes to groundwater in the regional watertable, which predominantly affect the ‘alluvium and watercourses in aquifer outcrop areas within and downstream of tenements’ system component identified in the conceptual model of causal pathways. The regional watertable represents the upper groundwater level within the near-surface aquifer, and may exist in different geological units or layers. Near the two additional coal resource developments it occurs in the alluvium, as well as the Main Range Volcanics and the Walloon Coal Measures. Springs and groundwater bores may be affected by hydrological changes in deeper geological layers, which may have repercussions for surface ecosystems surrounding springs.
The regional watertable in the Maranoa-Balonne-Condamine assessment extent occurs in the alluvial and basalt aquifers and parts of the deeper Great Artesian Basin (GAB) aquifers that outcrop in the north, north-west, north-east and east along the Great Dividing Range (Figure 7). The Assessment team used data from the OGIA model to determine the uppermost geological layers in each of the 1.5 km x 1.5 km OGIA model grid cells (~160,000 cells). Numerical groundwater modelling is described in companion product 2.6.2 for the Maranoa-Balonne-Condamine subregion (Janardhanan et al., 2016).
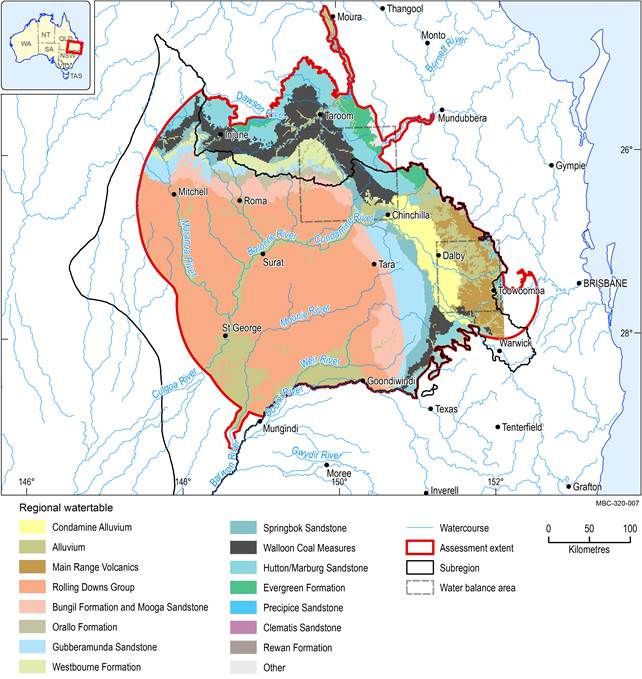
Figure 7 Regional watertable aquifers for the Maranoa-Balonne-Condamine subregion
Data: Bioregional Assessment Programme (Dataset 2)
The spatial distribution of geological units in the modelled regional watertable and simplified surface geology in the vicinity of New Acland Coal Mine and The Range are shown in Figure 8 and Figure 9, respectively. The OGIA model is a simple, idealised representation of a complex three-dimensional geologic system that is converted into a three-dimensional mathematical representation of the physical system and flow processes. The model simplifies the regional hydrostratigraphy by grouping geologic formations with similar aquifer properties into model layers representing the major aquifers, aquitards and productive coal measures.
The modelled regional watertable in the vicinity of New Acland Coal Mine is represented by model layer 1, being either alluvium, Condamine Alluvium or Main Range Volcanics based on the surface geology in each assessment unit (Figure 8). The simplified surface geology shows that New Acland Coal Mine is located on an area of Walloon Coal Measures outcrop, which is not represented in the regional model. Similarly, the regional watertable does not include the area of outcropping Marburg Sandstone to the north-east of New Acland Coal Mine, which is represented as alluvium in model layer 1. Small patches of ‘Other – sand plain’ near the edges of areas mapped as Main Range Volcanics are represented in the regional watertable as alluvium. Modelled hydraulic conductivity and storage parameters for the model layers that represented the ‘major aquifers’ used in the uncertainty analysis are comparable and of the same order of magnitude.
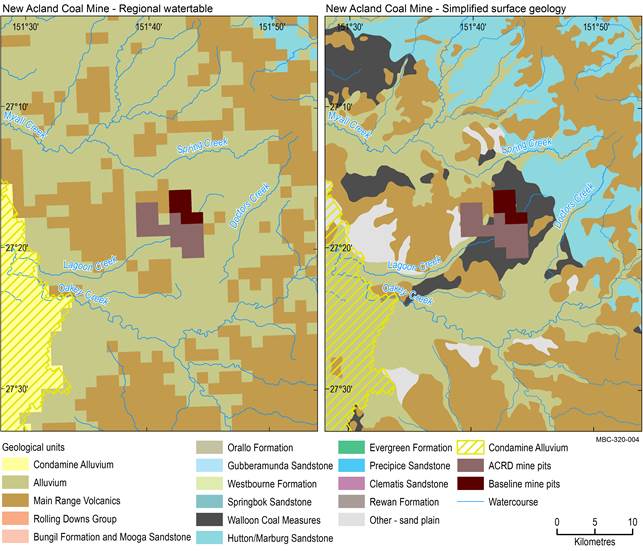
CSG = coal seam gas. The surface geology of layers is simplified to be consistent with the geological units represented in the regional groundwater model.
Data: Bioregional Assessment Programme (Dataset 2); Geoscience Australia (Dataset 3)
The regional watertable in the vicinity of The Range includes areas of alluvium associated with Roche and Juandah creeks, which were represented by individual model grid cells (Figure 9). Areas of outcropping Walloon Coal Measures in the regional model were mapped as ‘Injune Creek Group’ and ‘sedimentary rocks 72357’. The Injune Creek Group in the Surat Basin is equivalent to the Westbourne and Eurombah formations, Springbok Sandstone and Walloon Coal Measures, which was represented in the regional model by layers 6 to 11 and shown as Walloon Coal Measures in Figure 9. The ‘Kumbarilla Beds’ in the Surat Basin is equivalent to the Bungil, Orallo and Westbourne formations and the Mooga, Gubberamunda and Springbok sandstones, which were represented in the regional groundwater model by layers 3 to 8 and shown as Springbok Sandstone in Figure 9.
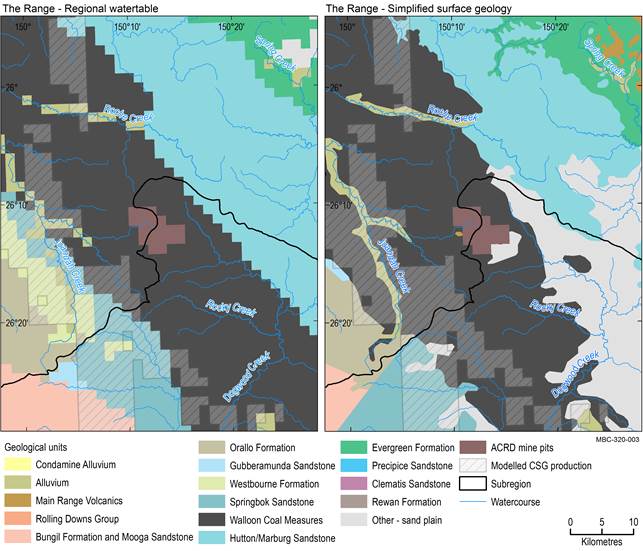
CSG = coal seam gas. The surface geology of layers is simplified to be consistent with the geological units represented in the regional groundwater model.
Data: Bioregional Assessment Programme (Dataset 2); Geoscience Australia (Dataset 3)
3.2.3.1.2 Groundwater model
This Assessment adapted the Office of Groundwater Impact Assessment’s (OGIA) 2012 model and the coal seam gas (CSG) development profile from OGIA’s 2014 annual report (OGIA, 2014). OGIA’s most recent model from 2016 was not available for this Assessment. The models are built for regional groundwater impact assessment in aquifers overlying and underlying the CSG target formations. OGIA also provided data relating to coal mines and their development footprints, which have been used to represent open-cut coal mines in the groundwater model at a regional scale using the 1.5 x 1.5 km grid cells. The area within modelled pits is not reported in this product.
OGIA is an independent entity established to assess and manage cumulative groundwater impacts from resource activities in areas of concentrated CSG development, known as cumulative management areas (CMAs). OGIA has undertaken cumulative assessments to capture the CSG footprints for the Surat and southern Bowen basins in 2012 (QWC, 2012) and 2016 (OGIA, 2016). These are reported through underground water impact reports (UWIRs) and are available from the Queensland Department of Natural Resources and Mines (2016). The UWIRs include predicted impacts on water supply bores and springs.
Most of the Maranoa-Balonne-Condamine subregion falls within the boundary of the geological Surat Basin, which forms part of the wider Great Artesian Basin (GAB). The variably confined layers of complex sandstone aquifers in the GAB are separated and confined by fine-grained mudstone and siltstone aquitards (Ransley and Smerdon, 2012). The intake beds for the GAB outcrop areas cover much of the subregion in the north and the east where the alluvial cover is absent. Important aquifer outcrop areas included in the regional watertable in the north and east of the subregion are:
- model layer 1 – Alluvium (Condamine) and Main Range Volcanics
- model layer 8 – Lower Springbok Sandstone
- model layer 10 – Walloon Coal Measures
- model layer 12 – Hutton/Marburg Sandstone.
Coal mining and CSG development in the Maranoa-Balonne-Condamine subregion targets the Walloon Coal Measures of the geological Surat and Clarence-Moreton basins.
All of the OGIA regional groundwater model layers were modelled as confined to improve numerical stability and reduce model run times. In the regional watertable, the OGIA model represented unconfined storage values using the specific yield (Sy) divided by the model layer thickness. By accounting for unconfined model layer thickness in this way, the storage coefficients used in the regional watertable minimise the potential overestimation of drawdown in the watertable.
In the Condamine Alluvium, the more-detailed Condamine Model was used to estimate impacts on groundwater levels that result from the change in groundwater flows between the Condamine Alluvium and the Walloon Coal Measures predicted by the regional model (QWC, 2012). The Condamine Model was not rerun for this Assessment. However, analysis of baseline drawdown predicted by the integrated models indicates that additional drawdown is very unlikely to exceed 0.2 m in the Condamine Alluvium, which is consistent with the regional model predictions in this area (see companion product 2.6.2 for the Maranoa-Balonne-Condamine subregion (Janardhanan et al., 2016)).
The range of model predictions for the impact and risk analysis were summarised by the 5th, 50th and 95th percentile estimates of drawdown in the regional watertable and deeper geological layers accessed by bores and springs. Previously, model predictions have been reported for the 95th percentile estimates of drawdown in each model layer (QWC, 2012; companion product 2.6.2 (Janardhanan et al., 2016)).
Maximum baseline drawdown, in excess of 700 m equivalent pressure changes, associated with baseline CSG production, is predicted near the towns of Chinchilla and Roma in model layer 10 – Walloon Coal Measures (see companion product 2.6.2 (Janardhanan et al., 2016)). This geological layer is the target of CSG production and is up to 1000 m below the surface in this area.
Baseline drawdown in the regional watertable is typically less than 20 m and occurs in the aquifer outcrop areas in the east and north of the subregion (Figure 10). The range of model predictions indicates that baseline drawdown in the regional watertable in excess of 0.2 m covers between 7,370 km2 (5th percentile) and 17,132 km2 (95th percentile). The regional watertable is typically up to 150 m thick in this area, but can be over 350 m thick in some areas.
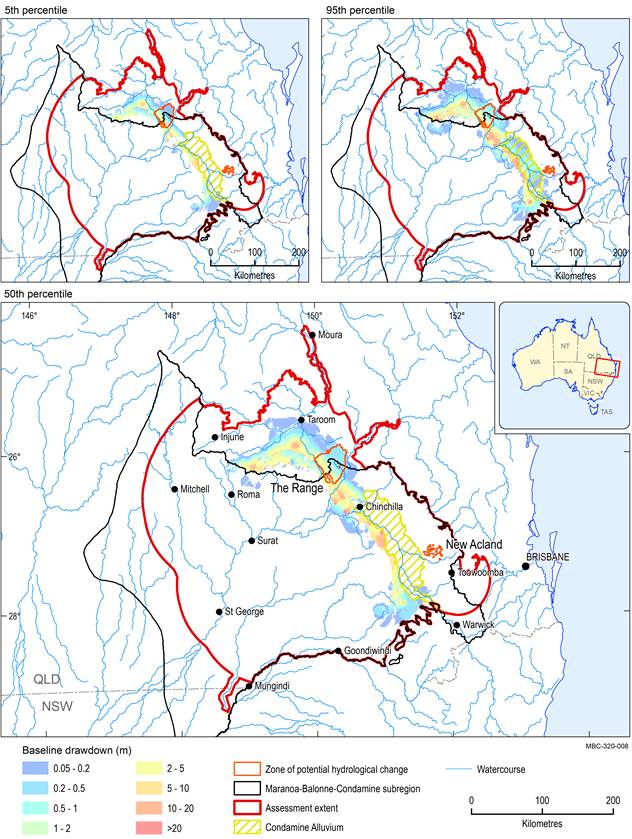
Figure 10 Baseline drawdown (m) in the regional watertable (5th, 50th and 95th percentiles)
Baseline drawdown is the maximum difference in drawdown (dmax) under the baseline relative to no coal resource development. Estimates of baseline drawdown in the Condamine Alluvium are only available for the 95th percentile as reported in QWC (2012). In a confined aquifer, drawdown relates to a change in water pressure and does not necessarily translate to changes in depth to watertable. The zone of potential hydrological change in the regional watertable is shown for reference.
Data: Bioregional Assessment Programme (Dataset 2, Dataset 4, Dataset 5); Office of Groundwater Impact Assessment (Dataset 6, Dataset 7)
