In assessing potential impacts on groundwater, changes were summarised by the hydrological response variable dmax – the maximum difference in drawdown, obtained by choosing the maximum of the time series of differences between two futures. Drawdowns were reported for a single regional watertable, which includes the alluvial and basalt aquifers and parts of the deeper Great Artesian Basin (GAB) aquifers represented in the groundwater model.
These dmax values were presented for the baseline (difference in results between the baseline and a ‘no-development’ model run) and due to additional coal resource development (difference in results between the CRDP run and the baseline run).
Regulatory authorities in Queensland and NSW have specified cumulative drawdown thresholds ranging from 0.2 m to 5 m. The Surat underground water impact report (QWC, 2012) identifies potentially affected springs as ‘springs where the water pressure in aquifers underlying the spring sites is predicted to decline by more than 0.2 m at any time in the future’. Queensland’s Water Act 2000 specifies bore trigger thresholds for drawdown of ‘5 m for consolidated aquifers (such as sandstone) and 2 m for unconsolidated aquifers (such as sands)’ (QWC, 2012). In NSW, ‘make good’ provisions apply for most aquifers where an activity results in drawdowns greater than 2 m. The exceptions are high-priority groundwater-dependent ecosystems (GDEs) and culturally significant sites in the GAB, where make good provisions apply if drawdowns exceed 0.2 m. These thresholds have therefore been used to define drawdown classes (≥0.2 m, ≥2 m and ≥5 m) for summarising the modelling results across all BAs.
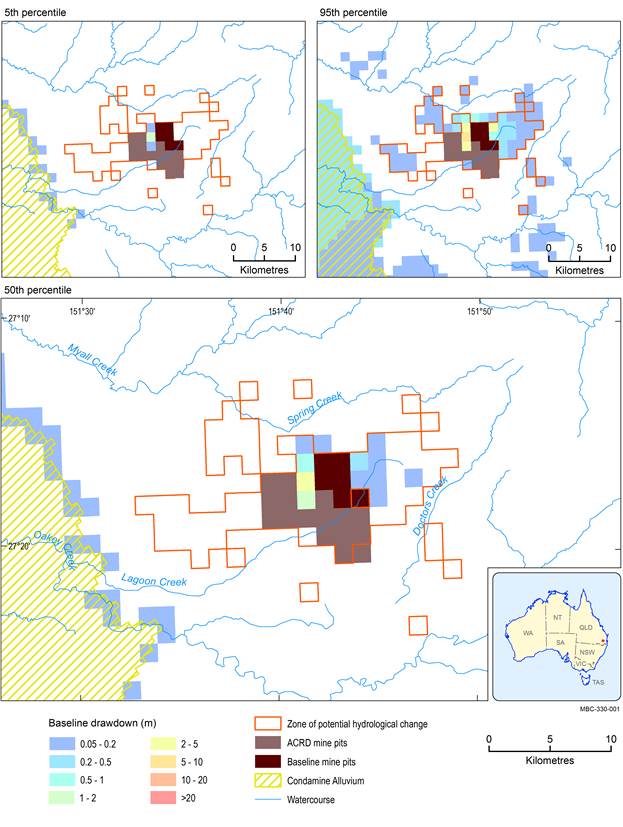
The 5th, 50th and 95th percentiles of drawdown under the baseline are shown in the vicinity of New Acland Coal Mine (Figure 14) and The Range coal mine (Figure 15). Median baseline drawdown in the zone of potential hydrological change is predominantly less than 2 m. Median baseline drawdown in excess of 2 m covers approximately 25% of the surface area (373 km2) and streams (301 km) in the zone (Figure 16 and Table 4).
Table 4 and Table 5 summarise the surface area and length of stream network where the 5th, 50th and 95th percentile estimates of baseline and additional drawdown exceed 0.2, 2 and 5 m within the zone in the vicinity of the two additional coal resource developments: New Acland Coal Mine Stage 3 and The Range coal mine.
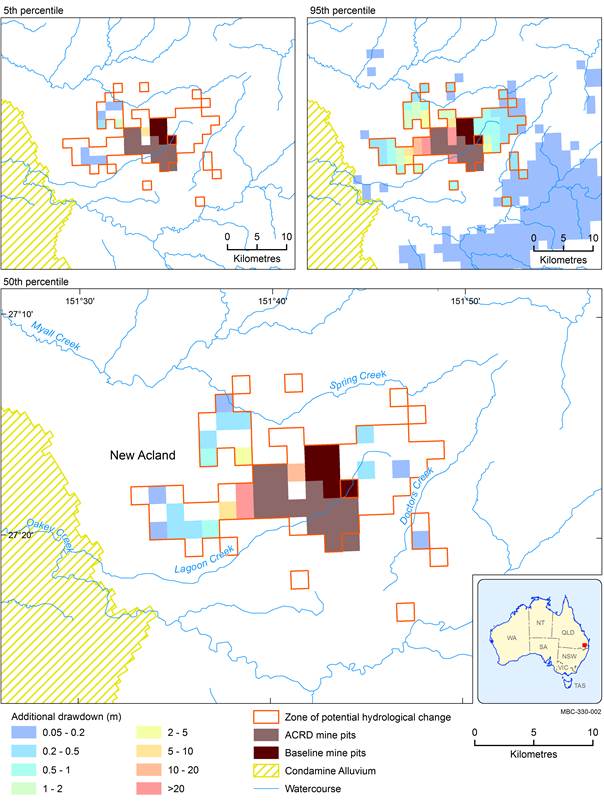
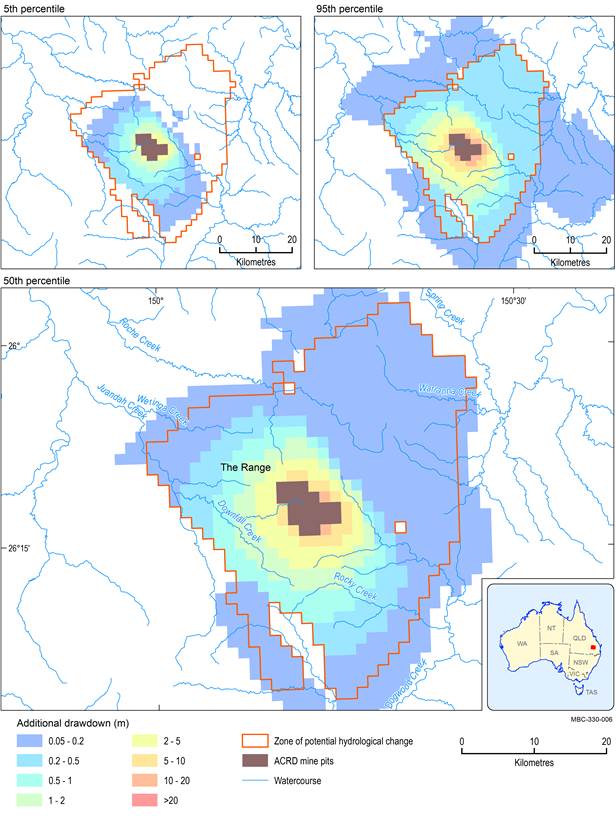
Drawdown due to additional coal resource development that exceeds 0.2 m in the regional watertable is predicted within 15 km of New Acland Coal Mine Stage 3 (Figure 17) and within 25 km of The Range coal mine (Figure 18). Median drawdown due to additional coal resource development in excess of 2 m is near the modelled mine pits and includes less than 10% of the surface area (144 km2) and streams (57 km) in the zone (Figure 16 and Table 5).
Median additional drawdown is up to 65 m in the vicinity of New Acland Coal Mine Stage 3 and up to 10.2 m in the vicinity of The Range coal mine. This indicates that additional drawdown is deeper, but more confined near New Acland Coal Mine Stage 3, and shallower and broader near The Range coal mine. Drawdown near the two mines is reported separately below.
Baseline drawdown is the maximum difference in drawdown (dmax) under the baseline relative to no coal resource development. In a confined aquifer, drawdown relates to a change in water pressure and does not necessarily translate to changes in depth to watertable. The mine pits in the CRDP are the sum of those in the baseline and the additional coal resource development (ACRD).
Data: Bioregional Assessment Programme (Dataset 1, Dataset 2, Dataset 3, Dataset 4); Office of Groundwater Impact Assessment (Dataset 5, Dataset 6)
Baseline drawdown is the maximum difference in drawdown (dmax) under the baseline relative to no coal resource development. In a confined aquifer, drawdown relates to a change in water pressure and does not necessarily translate to changes in depth to watertable. ACRD = additional coal resource development
Data: Bioregional Assessment Programme (Dataset 1, Dataset 2, Dataset 3, Dataset 4); Office of Groundwater Impact Assessment (Dataset 5)

Colours represent the 5th, 50th and 95th percentile. Baseline drawdown is the maximum difference in drawdown (dmax) under the baseline relative to no coal resource development. Additional drawdown is the maximum difference in drawdown (dmax) between the coal resource development pathway (CRDP) and baseline, due to additional coal resource development. Areas within modelled mine pits are not included in this analysis.
Data: Bioregional Assessment Programme (Dataset 7)
Table 4 Surface area and stream length potentially exposed to varying levels of baseline drawdown in the vicinity of the two additional coal resource developments, New Acland Coal Mine Stage 3 and The Range coal mine
aThis extent does not include the extent in modelled open-cut mine pits.
The extent potentially exposed to ≥0.2, ≥2 and ≥5 m baseline drawdown is shown for the 5th, 50th and 95th percentiles of the maximum difference in drawdown (dmax) under the baseline relative to no coal resource development. In a confined aquifer, drawdown relates to a change in water pressure and does not necessarily translate to changes in depth to watertable.
Due to rounding, some totals may not correspond with the sum of the separate numbers.
Data: Bioregional Assessment Programme (Dataset 7)
Table 5 Surface area and stream length potentially exposed to varying levels of additional drawdown in the vicinity of the two additional coal resource developments, New Acland Coal Mine Stage 3 and The Range coal mine
aThis extent does not include the extent in modelled open-cut mine pits.
The extent potentially exposed to ≥0.2, ≥2 and ≥5 m additional drawdown is shown for the 5th, 50th and 95th percentile estimates of the maximum difference in drawdown (dmax) between the coal resource development pathway (CRDP) and baseline, due to additional coal resource development. In a confined aquifer, drawdown relates to a change in water pressure and does not necessarily translate to changes in depth to watertable.
Due to rounding, some totals may not correspond with the sum of the separate numbers.
Data: Bioregional Assessment Programme (Dataset 7)
Additional drawdown is the maximum difference in drawdown (dmax) between the coal resource development pathway (CRDP) and baseline, due to additional coal resource development. In a confined aquifer, drawdown relates to a change in water pressure and does not necessarily translate to changes in depth to watertable. The mine pits in the CRDP are the sum of those in the baseline and the additional coal resource development (ACRD).
Data: Bioregional Assessment Programme (Dataset 1, Dataset 2, Dataset 3, Dataset 4); Office of Groundwater Impact Assessment (Dataset 5)
Additional drawdown is the maximum difference in drawdown (dmax) between the coal resource development pathway (CRDP) and baseline, due to additional coal resource development. In a confined aquifer, drawdown relates to a change in water pressure and does not necessarily translate to changes in depth to watertable. ACRD = additional coal resource development
Data: Bioregional Assessment Programme (Dataset 1, Dataset 2, Dataset 3, Dataset 4); Office of Groundwater Impact Assessment (Dataset 5)
The range of model predictions in the vicinity of New Acland Coal Mine Stage 3 indicates that the extent of baseline drawdown in the regional watertable in excess of 0.2 m within the zone is between 2 km2 including 1 km of streams and 31 km2, which includes 13 km of streams. Baseline drawdown in excess of 5 m in the regional watertable is very unlikely to exceed 2 km2, which includes 1 km of streams (95th percentile). Median baseline drawdown is up to 3.0 m in the regional watertable, which is located near the modelled mine pits (Figure 14).
Additional drawdown in this area is predicted to lower the regional watertable by an additional 0.2 m over an area of between 7 km2 including 4 km of streams (5th percentile) and 134 km2 including 55 km of streams (95th percentile). The area affected by additional drawdown in the regional watertable in excess of 5 m ranges from 2 km2 including 1 km of streams (5th percentile) to 20 km2 including 9 km of streams (95th percentile). Median additional drawdown is up to 65 m in the regional watertable next to the modelled mine pits (Figure 17).
In the vicinity of New Acland Coal Mine, the regional watertable is represented in the model by model layer 1, thereby including only alluvium (including Condamine Alluvium) or Main Range Volcanics geologic units (Figure 7). The integrated Condamine and regional models (QWC, 2012), used to estimate baseline drawdown, indicate that additional drawdown is very unlikely to exceed 0.2 m in the Condamine Alluvium (see companion product 2.6.2 for the Maranoa-Balonne-Condamine subregion (Janardhanan et al., 2016)).
Geological mapping shows that New Acland Coal Mine Stage 3 overlies outcropping Walloon Coal Measures, as well as Main Range Volcanics and Cenozoic units (Figure 43 in companion product 2.3 (Holland et al., 2016)). The regional model does not include this area of outcropping Walloon Coal Measures in the regional watertable as it is not the role of a regional model to represent these local-scale geological features. The extent of the zone of potential hydrological change in the regional watertable would change if these outcropping areas were represented in the regional model.
Economic groundwater bores and springs access the regional watertable and deeper aquifers in the vicinity of the New Acland Coal Mine. Figure 19 and Figure 20 show the spatial distribution of median baseline and additional drawdown in these deeper layers. In the vicinity of New Acland Coal Mine, the zone of potential hydrological change covers 134 km2 of the regional watertable, 849 km2 of model layer 10 – Walloon Coal Measures and 750 km2 of model layer 12 – Hutton/Marburg Sandstone.
Extraction of groundwater to enable dewatering of open-cut mine pits at New Acland Coal Mine has the greatest cumulative impact on water levels in model layer 10 – Walloon Coal Measures. Near the mine, median drawdown in this layer is up to 3.6 m under the baseline and up to 24.9 m due to additional coal resource development. Further west, near the eastern edge of the Condamine Alluvium, median baseline drawdown due to CSG development is less than 2 m in this layer. However, this does not overlap with the baseline drawdown near the mine.
Median additional drawdown in the vicinity of the New Acland Coal Mine is up to 65 m in the regional watertable near the modelled mine pits, up to 24.9 m in model layer 10 – Walloon Coal Measures and up to 1.7 m in model layer 12 – Hutton/Marburg Sandstone (Figure 20). Additional drawdown in this area is associated with the cumulative effects of the proposed mine pits.
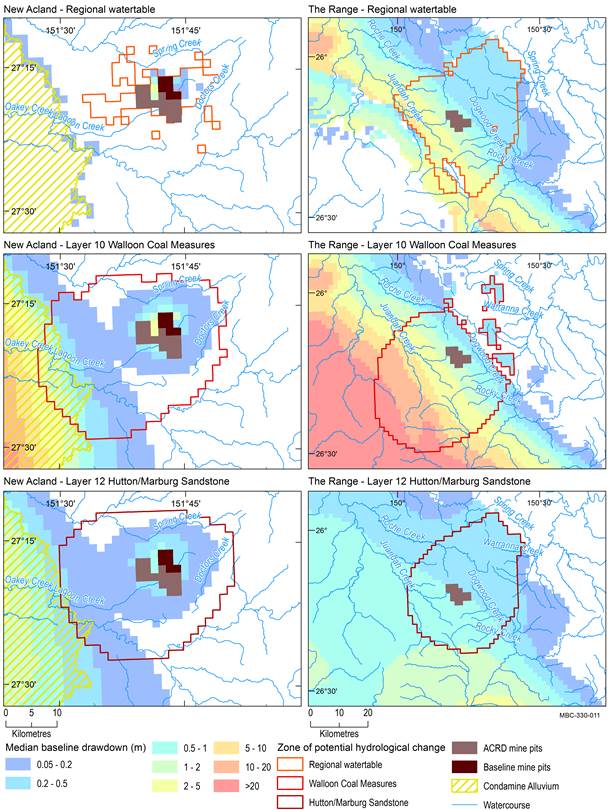
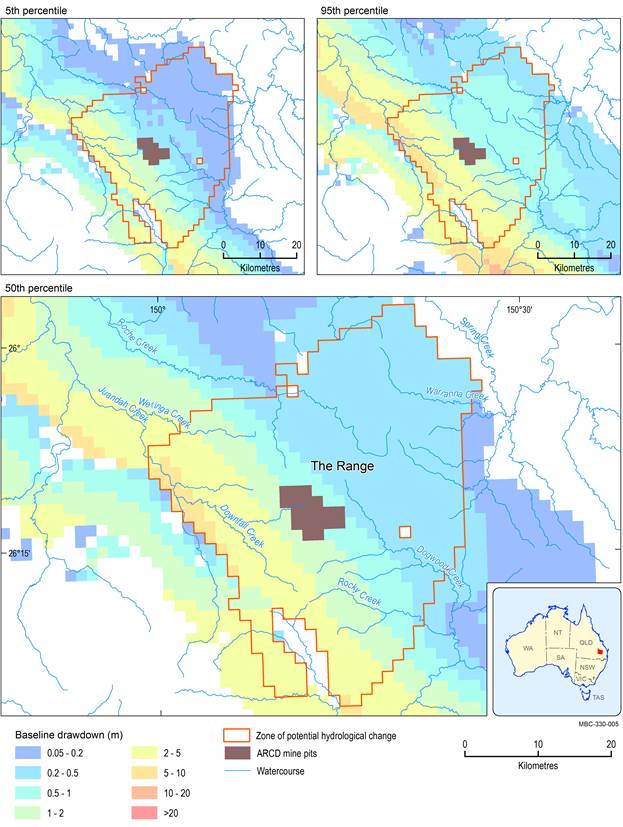
Baseline drawdown is the maximum difference in drawdown (dmax) under the baseline relative to no coal resource development. In a confined aquifer, drawdown relates to a change in water pressure and does not necessarily translate to changes in depth to watertable. The mine pits in the CRDP are the sum of those in the baseline and the additional coal resource development (ACRD).
Data: Bioregional Assessment Programme (Dataset 1, Dataset 2, Dataset 3, Dataset 4, Dataset 8); Office of Groundwater Impact Assessment (Dataset 5)
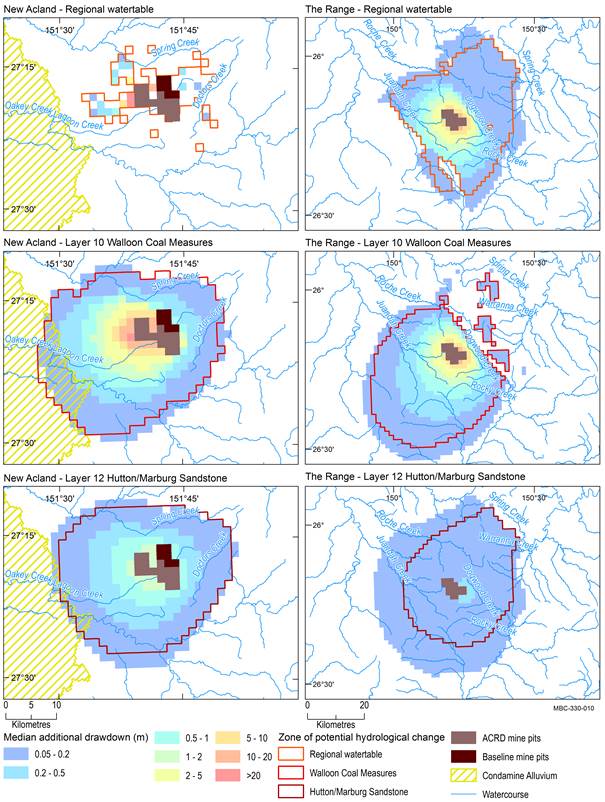
Additional drawdown is the maximum difference in drawdown (dmax) between the coal resource development pathway (CRDP) and baseline, due to additional coal resource development. In a confined aquifer, drawdown relates to a change in water pressure and does not necessarily translate to changes in depth to watertable. The mine pits in the CRDP are the sum of those in the baseline and the additional coal resource development (ACRD).
Data: Bioregional Assessment Programme (Dataset 1, Dataset 2, Dataset 3, Dataset 4, Dataset 8); Office of Groundwater Impact Assessment (Dataset 5)
The range of model predictions in the vicinity of The Range coal mine indicates that the extent of baseline drawdown in the regional watertable in excess of 0.2 m within the zone is between 866 km2 including 600 km of streams and 1409 km2, which includes 1040 km of streams. Baseline drawdown in excess of 5 m in the regional watertable is very unlikely to cover more than 103 km2, which includes 102 km of streams (95th percentile). Median baseline drawdown is up to 8.3 m in the regional watertable, which is located along the western edge of the zone and is associated with baseline CSG production (Figure 15).
Additional drawdown in this area is predicted to lower the regional watertable by an additional 0.2 m over an area of between 377 km2 including 231 km of streams (5th percentile) and 1409 km2 including 1040 km of streams (95th percentile). The area affected by additional drawdown in the regional watertable in excess of 2 m ranges from 22 km2 including 8 km of streams (5th percentile) to 242 km2 including 126 km of streams (95th percentile). Median additional drawdown is up to 10.2 m in the regional watertable next to the modelled mine pits (Figure 18).
In the vicinity of The Range coal mine, the regional watertable includes outcropping areas of Springbok Sandstone, Walloon Coal Measures and Hutton/Marburg Sandstone, which is generally consistent with surface geological mapping in this area (Figure 40 in companion product 2.3 (Holland et al., 2016)). Figure 19 and Figure 20 show the spatial distribution of median baseline and additional drawdown in these deeper layers. In the vicinity of The Range coal mine, the zone of potential hydrological change covers 1409 km2 of the regional watertable, 1696 km2 of model layer 10 – Walloon Coal Measures and 1361 km2 of model layer 12 – Hutton/Marburg Sandstone.
Median baseline drawdown in the regional watertable near The Range coal mine is 8.3 m and drawdown due to additional coal resource development is 10.2 m. Extraction of groundwater to enable baseline CSG production has the greatest impact on water levels in model layer 10 – Walloon Coal Measures, the target of CSG production, in this area. Median drawdown in this layer is up to 82.0 m under the baseline and up to 10.2 m due to additional coal resource development. Median drawdown in the underlying model layer 12 – Hutton/Marburg Sandstone is less, being up to 1.1 m under the baseline and less than 0.2 m due to additional coal resource development.
