Twelve of the 23 assets in the ‘Groundwater feature (subsurface)’ subgroup are potentially impacted by drawdown due to additional coal resource development (Table 21). This includes:
- 11 assets that overlap most of the zone of potential hydrological change (Table 22 and Table 23) and so cannot be shown individually in this product. This includes the spatial extent of 11 aquifers or geological features, including Great Artesian Basin (GAB) recharge areas, Condamine Alluvium, Main Range Volcanics, Hutton/Marburg and Springbok sandstone aquifers, and the Walloon Coal Measures
- 1 multi-point asset that includes 252 of 13,249 groundwater production bores in the vicinity of the Condamine Alluvium. The bores included in this asset are only located near New Acland Coal Mine (Figure 35).
The area of aquifer or geological feature where the median (50th percentile) estimate of drawdown due to additional coal resource development exceeds 0.2 m includes 618 km2 and in excess of 2 m covers 144 km2. Median additional drawdown is less than 5 m, with the exception of 49 km2 in the immediate vicinity of the operational areas (Table 23).
Median drawdown under the baseline is predominantly less than 2 m, covering 373 km2 of the 1532 km2 of aquifer or geological feature in the zone of potential hydrological change. Median drawdown under the baseline in excess of 5 m, associated with coal seam gas (CSG) development to the west of The Range proposed coal mine, covers 43 km2 located along the south-western edge of the zone of potential hydrological change (Figure 35 and Table 22).
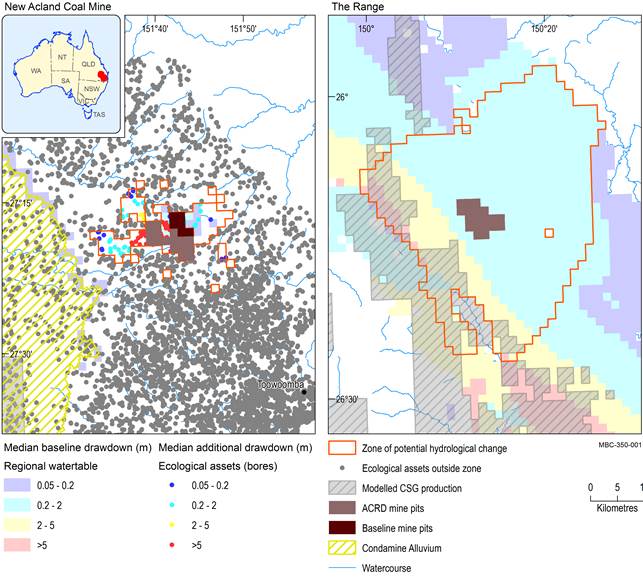
Baseline drawdown is the maximum difference in drawdown (dmax) under the baseline relative to no coal resource development. Additional drawdown is the maximum difference in drawdown (dmax) between the coal resource development pathway (CRDP) and baseline, due to additional coal resource development. The mine pits in the CRDP are the sum of those in the baseline and the additional coal resource development. Areas within modelled open-cut pits (Table 4) are not included in this analysis.
ACRD = additional coal resource development, CSG = coal seam gas
This figure shows the location of bores contained in multi-point asset 9490 - ‘Groundwater production bores (13249 Bores mostly in Condamine)’, which is classified as an ecological asset in the water-dependent asset register in the ‘Groundwater feature (subsurface)’ subgroup and ‘Aquifer, geological feature, alluvium or stratum’ class.
Data: Bioregional Assessment Programme (Dataset 2, Dataset 4, Dataset 5, Dataset 6, Dataset 7, Dataset 8)
Table 22 Number and area of ecological water-dependent assets in the ‘Groundwater feature (subsurface)’ subgroup that exceed the 5th, 50th and 95th percentile estimates of baseline drawdown (m) in the zone of potential hydrological change
aNumbers in table are italicised, to distinguish from areas. Numbers within the whole zone are included in this analysis.
bAreas within modelled open-cut mine pits (Table 4) are not included in this analysis.
cExtent could be number or area.
‘–’ means ‘not applicable’. The extent potentially exposed to ≥0.2, ≥2 and ≥5 m baseline drawdown is shown for the 5th, 50th and 95th percentile estimates of the maximum difference in drawdown (dmax) under the baseline relative to no coal resource development. Areas within modelled open-cut mine pits (Table 4) are not included in this analysis. The zone of potential hydrological change is defined as the area with a greater than 5% chance of exceeding 0.2 m drawdown due to additional coal resource development.
Data: Bioregional Assessment Programme (Dataset 3)
Table 23 Number and extent of ecological water-dependent assets in the ‘Groundwater feature (subsurface)’ subgroup that exceed the 5th, 50th and 95th percentile estimates of additional drawdown (m) in the zone of potential hydrological change
aNumbers in table are italicised, to distinguish from areas. Numbers within the whole zone are included in this analysis.
bAreas within modelled open-cut mine pits (Table 4) are not included in this analysis.
cExtent could be number or area.
‘–’ means ‘not applicable’. The extent potentially exposed to ≥0.2, ≥2 and ≥5 m additional drawdown is shown for the 5th, 50th and 95th percentile estimates of the maximum difference in drawdown (dmax) between the coal resource development pathway (CRDP) and baseline, due to additional coal resource development. Areas within modelled open-cut mine pits (Table 4) are not included in this analysis. The zone of potential hydrological change is defined as the area with a greater than 5% chance of exceeding 0.2 m drawdown due to additional coal resource development.
Data: Bioregional Assessment Programme (Dataset 3)
