Twenty-nine ecological assets classified in the ‘Surface water feature’ subgroup overlap the zone of potential hydrological change (Table 21 and Figure 36). This includes:
- 18 assets classified as ‘River or stream reach, tributary, anabranch or bend’ that cover 18,075 km2 of catchment area and 32,261 km of stream length, comprising
- 1 stream on the Auburn River and tributaries in the Burnett river basin
- 2 catchment areas, Upper Myall and Upper Oakey Creeks, in the Condamine river basin
- 15 streams in the Fitzroy river basin, including Bungaban, Downfall, Juandah, Roche, Six Mile, Twenty Mile, Two Mile and Weringa creeks
- 11 assets classified as ‘Wetland, wetland complex or swamp’ that cover 1.5 km2 of wetland area and 1429 km of streams included in Queensland’s wetland mapping, comprising
- 4 wetland areas mapped as ‘Artificial/highly modified wetlands (dams, ring tanks, irrigation channel)’ in the Balonne, Boyne and Auburn, Condamine and Dawson river basins
- 3 riverine wetland areas in the Balonne and Dawson river basins
- 2 wetland areas mapped as ‘Catchment Coastal/Sub-coastal floodplain grass, sedge and herb swamps’ or ‘Coastal/Sub-coastal floodplain lakes’ in the Dawson river basin
- 1 asset containing streams included in Queensland’s wetland mapping
- 1 wetland regional ecosystem.
None of the 882 assets classified as ‘Floodplain’, ‘Lake, reservoir, lagoon or estuary’, ‘Marsh, sedgeland, bog, spring or soak’ or ‘Waterhole, pool, rock pool or billabong’ are located within the zone of potential hydrological change (Table 21). Potential impacts on springs and spring complexes, including watercourse springs, are assessed in Section 3. 4. This includes the 177 springs previously assessed.
The extent of rivers or streams where the median (50th percentile) estimate of drawdown due to additional coal resource development exceeds 0.2 m includes 8 km2 of catchment area and 231 km of stream length. Median additional drawdown is less than 5 m, with the exception of 5 km of streams in the immediate vicinity of the operational areas (Table 25). Median drawdown under the baseline is predominantly less than 2 m, except for 194 km of streams in the zone of potential hydrological change (Figure 37 and Table 24).
The extent of wetlands where the median (50th percentile) estimate of drawdown due to additional coal resource development exceeds 0.2 m includes less than 1 km2 of wetland area and 532 km of wetland streams. Median additional drawdown is less than 5 m, with the exception of less than 1 km2 of wetland area and 25 km of wetland streams in the immediate vicinity of the operational areas (Table 25). Median drawdown under the baseline is predominantly less than 5 m, except for less than 1 km2 of wetland area and 55 km of wetland streams in the zone of potential hydrological change (Figure 37 and Table 24).
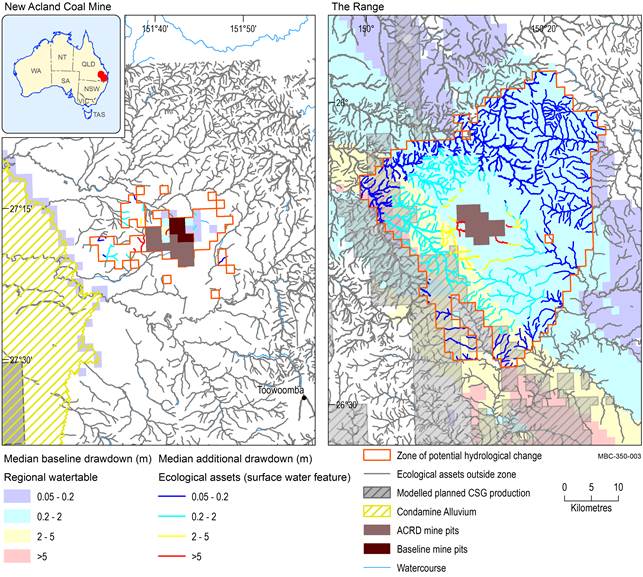
Baseline drawdown is the maximum difference in drawdown (dmax) under the baseline relative to no coal resource development. Additional drawdown is the maximum difference in drawdown (dmax) between the coal resource development pathway (CRDP) and baseline, due to additional coal resource development. The mine pits in the CRDP are the sum of those in the baseline and the additional coal resource development. Areas within modelled open-cut mine pits (Table 4) are not included in this analysis.
CSG = coal seam gas
Data: Bioregional Assessment Programme (Dataset 2, Dataset 4, Dataset 5, Dataset 6, Dataset 7, Dataset 8)
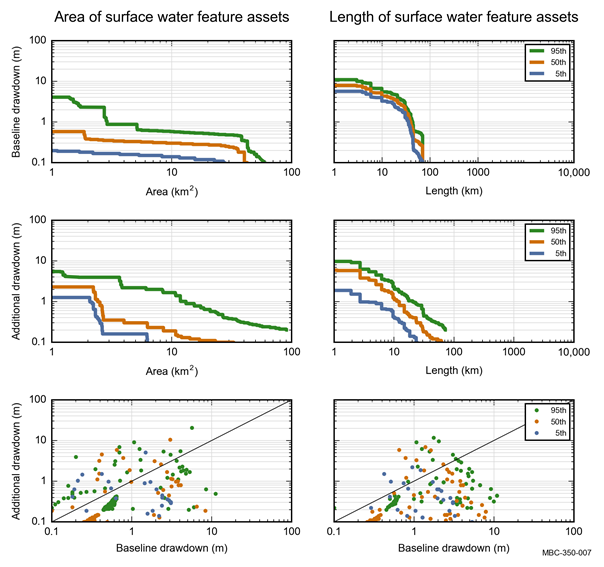
Colours represent the 5th, 50th and 95th percentile. Baseline drawdown is the maximum difference in drawdown (dmax) under the baseline relative to no coal resource development. Additional drawdown is the maximum difference in drawdown (dmax) between the coal resource development pathway (CRDP) and baseline, due to additional coal resource development. Areas within modelled open-cut mine pits (Table 4) are not included in this analysis.
Data: Bioregional Assessment Programme (Dataset 3)
Table 24 Number and extent of ecological water-dependent assets in the ‘Surface water feature’ subgroup that exceed the 5th, 50th and 95th percentile estimates of baseline drawdown (m) in the zone of potential hydrological change
aNumbers in table are italicised, to distinguish from areas. Numbers within the whole zone are included in this analysis.
bLengths or areas within modelled open-cut mine pits (Table 4) are not included in this analysis.
cExtent could be a number, length or area.
‘–’ means ‘not applicable’. The extent potentially exposed to ≥0.2, ≥2 and ≥5 m baseline drawdown is shown for the 5th, 50th and 95th percentile estimates of the maximum difference in drawdown (dmax) under the baseline relative to no coal resource development. Areas and lengths within modelled open-cut mine pits (Table 4) are not included in this analysis. The zone of potential hydrological change is defined as the area with a greater than 5% chance of exceeding 0.2 m drawdown due to additional coal resource development.
Data: Bioregional Assessment Programme (Dataset 3)
Table 25 Number and extent of ecological water-dependent assets in the ‘Surface water feature’ subgroup that exceed the 5th, 50th and 95th percentile estimates of additional drawdown (m) in the zone of potential hydrological change
aNumbers in table are italicised, to distinguish from areas. Numbers within the whole zone are included in this analysis.
bLengths or areas within modelled open-cut mine pits (Table 4) are not included in this analysis.
cExtent could be a number, length or area.
‘–’ means ‘not applicable’. The extent potentially exposed to ≥0.2, ≥2 and ≥5 m additional drawdown is shown for the 5th, 50th and 95th percentile estimates of the maximum difference in drawdown (dmax) between the coal resource development pathway (CRDP) and baseline, due to additional coal resource development. Areas within modelled pits (Table 4) are not included in this analysis. The zone of potential hydrological change is defined as the area with a greater than 5% chance of exceeding 0.2 m drawdown due to additional coal resource development.
Data: Bioregional Assessment Programme (Dataset 3)
