The models used in the Assessment produced a large number of predictions of groundwater drawdown rather than a single number. This resulted in a range or distribution of predictions, which are typically reported as probabilities – the percent chance of something occurring (Figure 11). This approach allowed an assessment of the likelihood of exceeding a given magnitude of change, and underpinned the assessment of the risk.
Groundwater models require information about physical properties such as the thickness of geological layers, how porous aquifers are, and whether faults are present. As the exact values of these properties are not always known, modellers used a credible range of values, which are based on various sources of data (commonly point-scale) combined with expert knowledge. The groundwater model was run hundreds of times using a different set of plausible values for those physical properties each time. Historical observations, such as groundwater level and changes in water movement and volume, were used to constrain and validate the model runs.
The complete set of model runs produced a range or distribution of predictions (Figure 11) that are consistent with available observations and the understanding of the modelled system. The range conveys the confidence in model results, with a wide range indicating that the expected outcome is less certain, while a narrow range provides a stronger evidence base for decision making. The distributions created from these model runs are expressed as probabilities that drawdown will exceed relevant thresholds, as there is no single ‘best’ estimate of change.
Model results are presented as the range of drawdown values for a defined probability or percentile and as the probability or percent chance of exceeding important threshold values. This enables the reader to understand the range of model predictions for defined probabilities, or to assess the probability or likelihood of exceeding defined regulatory thresholds.
In this Assessment, estimates of drawdown are shown as 95th, 50th or 5th percentile results, corresponding to a 5%, 50% or 95% chance of exceeding thresholds. Figure 12 illustrates this predictive uncertainty within a spatial context. Throughout this product, the term ‘very likely’ is used to describe where there is a greater than 95% chance of something occurring, and ‘very unlikely’ is used where there is a less than 5% chance.
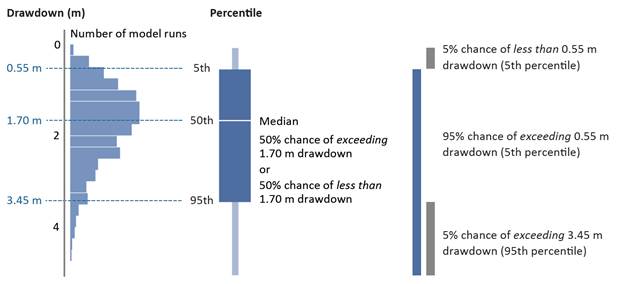
The chart on the left shows the distribution of results for drawdown, obtained from an ensemble of thousands of model runs that use many sets of parameters. These generic results are for illustrative purposes only and are not actual results from the Maranoa-Balonne-Condamine subregion.
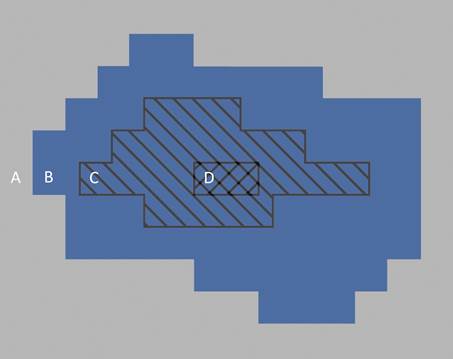
Figure 12 Illustrative example of key areas in the landscape defined by probabilistic results
The assessment extent was divided into smaller square assessment units and the probability distribution (Figure 11) was calculated for each. In this product results are reported with respect to the following key areas:
A. outside the zone of potential hydrological change, where hydrological changes (and hence impacts) are very unlikely (defined by maps showing the 95th percentile)
B. inside the zone of potential hydrological change, comprising the assessment units with at least a 5% chance of exceeding the threshold (defined by maps showing the 95th percentile). Further work is required to determine whether the hydrological changes in the zone translate into impacts for water-dependent assets and landscapes
C. with at least a 50% chance of exceeding the threshold (i.e. the assessment units where the median is greater than the threshold; defined by maps showing the 50th percentile)
D. with at least a 95% chance of exceeding the threshold (i.e. the assessment units where hydrological changes are very likely; defined by maps showing the 5th percentile).
