Groundwater level observations and their spatial interpolations were imported into the preliminary three-dimensional geological model in GoCAD to assess hydraulic relationships between aquifers and streams. Two-dimensional cross-sections were then created from the three-dimensional geological model at selected locations where observation bore transects exist.
Three examples are shown from different river basins within the bioregion to highlight the usefulness of this approach and also some of the limitations.
Lockyer Valley
Figure 66 shows a cross-section from the Laidley Creek, a tributary of the Lockyer Creek in the Lockyer Valley. This cross-section demonstrates the dynamic interaction during the drought (represented by the 2007 data), the subsequent break of the drought (represented by the 2009 data), and following the extreme flooding of 2011 (represented by the 2013 data). In addition, it shows the relationship to the potentiometric surface of the Gatton Sandstone and the groundwater level surface of the alluvial aquifer. The following can be concluded:
- During the drought, groundwater levels in the alluvial aquifer were generally low, and well below the streambed level. This suggests that there was probably no hydraulic connection between the stream and the underlying aquifer. Increasing groundwater ECs in the alluvial aquifer can be attributed to groundwater discharge from the bedrock to the alluvial aquifer (particularly at the edge of the alluvium), as the potentiometric surface of the Gatton Sandstone was considerably above the groundwater level of the alluvial aquifer (and therefore, there was strong potential for upwards discharge).
- Following a significant rise of water levels after the break of the drought, Figure 66 (2009 data) shows the changing nature of the hydraulic connection where the losing Laidley Creek has recharged the underlying alluvial aquifer.
- Following the extensive flooding of 2011, the groundwater levels continued to recover with groundwater level observations from 2013 indicating that Laidley Creek has turned into a gaining stream.
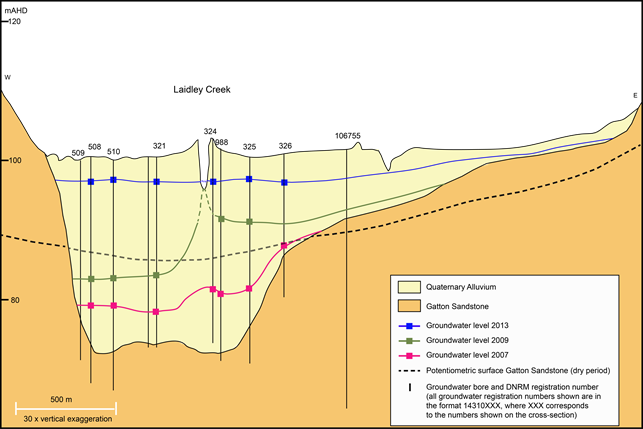
Note the spatial and temporal variability of the hydraulic relationships between the Lockyer Creek and the alluvial aquifer. With the exception of groundwater bore 106755, all groundwater registration numbers shown are in the format 14320XXX, where XXX corresponds to the three numbers shown on the cross-section (with exception of groundwater bore 106755, which follows a different numbering system). The potentiometric surface of the Gatton Sandstone is based on the kriging interpolation presented in Section 2.1.3.3.1.
Data: Geoscience Australia (Dataset 4), Bioregional Assessment Programme (Dataset 5, Dataset 6)
Bremer river basin
Groundwater levels of the alluvial aquifer and the potentiometric surface of the Walloon Coal Measures show that the response of the alluvial aquifer to drought and subsequent flooding and the nature of its hydraulic connectivity with the Bremer River are different to those observed for Laidley Creek.
- During the drought, groundwater levels decreased substantially. In some instances (i.e. bores near the Bremer River, such as bore number 14310051), the groundwater level in 2007 was very close to the base of the alluvium. This indicates a poor hydraulic connection between the aquifer and the river.
- Following the break of the drought, the groundwater level in the Bremer River alluvium recovered in bores near the Bremer River, probably due to recharge from the stream. However, in contrast to Laidley Creek, groundwater levels in bores distant from the river showed little or no recovery in groundwater levels after the break of drought and post the 2011 flooding, which suggests that stream recharge has a limited lateral extent and does not reach far across the floodplain at this location. In addition, this also suggests that rainfall recharge has a long delay time through the unsaturated zone.
The differences in the groundwater level response observed in the examples from Laidley Creek and the Bremer River are probably linked to the geology and geomorphology. The valley of Laidley Creek is considerably narrower than the broad valley of the Bremer River, and in contrast to the Bremer River, Laidley Creek is deeply incised into the alluvial aquifer, and has probably penetrated the clay-rich floodplain sediments that are present at the top of the alluvial sequence and can act as a seal that may limit groundwater recharge.
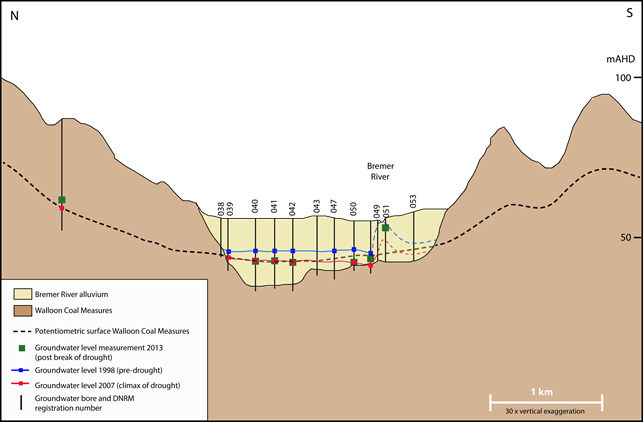
Figure 67 Geological cross-section through the Bremer river basin
Note the hydraulic relationships between the Bremer River and the alluvial aquifer. The topographic surface is based on the 1‑second Shuttle Radar Topography Mission DEM data (Geoscience Australia and CSIRO Land and Water, 2010). The potentiometric surface of the Walloon Coal Measures is based on the kriging interpolation presented in Section 2.1.4. All groundwater registration numbers shown are in the format 14310XXX, where XXX corresponds to the numbers shown on the cross-section.
Data: Geoscience Australia (Dataset 4), Bioregional Assessment Programme (Dataset 5, Dataset 6)
Richmond river basin
The response of groundwater levels to rainfall events or longer-term climate variability in the Richmond river basin is not as well constrained as in the Queensland basins due to a lack of groundwater observation bores. However, the incorporation of groundwater level surfaces into the three-dimensional geological model suggests that there was a substantial change from the drought to post-drought.
Some observations based on the cross-section and water level fluctuation are:
- Groundwater levels in this central part of the Richmond river basin are generally shallow.
- During the drought, groundwater levels dropped to approximately 10 m below the ground surface, which may have resulted in a disconnection of the aquifers and streams.
- During normal conditions, the groundwater levels are shallow, and there is likely to be some connection between the alluvial aquifer and the streams, as indicated by the intersection of the water level surface with the ground surface.
However, the spatial modelling of groundwater levels (using kriging interpolation, Section 2.1.3.3.1) is based on a small number of groundwater level measurements in this area, and the uncertainty associated with the modelling is therefore high as indicated by a high standard deviation (Section 2.1.3.3.1). In addition, due to the low relief of the ground surface in this wide floodplain, the 1-second SRTM DEM data may not adequately capture the variability of the ground surface topography.
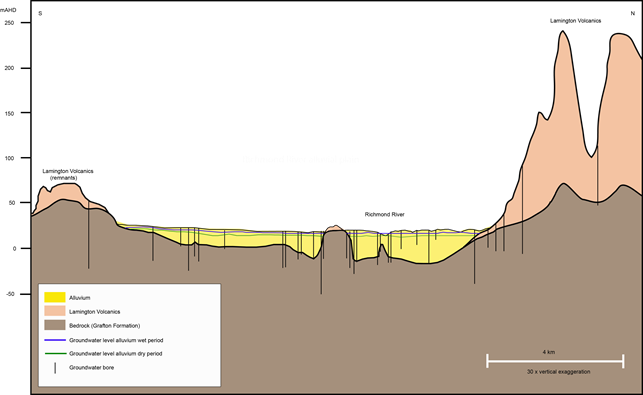
Figure 68 Geological cross-section through the Richmond river basin
Note the hydraulic relationships between the Richmond River and the alluvial aquifer and the change of the interpolated alluvial groundwater level during drought and post-drought conditions (Section 2.1.4). The topographic surface is based on the 1-second Shuttle Radar Topography Mission DEM data (Geoscience Australia and CSIRO Land and Water, 2010).
Data: Geoscience Australia (Dataset 4), Bioregional Assessment Programme (Dataset 6, Dataset 7)
