Figure 31 shows the log-linear relationship for estimating annual average recharge from annual average rainfall. This shows that for a given rainfall amount the Cenozoic volcanics have higher recharge than the Walloon Coal Measures; the other surface geology types have a considerable spread around the line of best fit. Figure 32 shows the upscaled annual average recharge with the highest recharge in the eastern part of the bioregion where rainfall is highest on the Cenozoic volcanics and alluvium; recharge is greatly reduced inland. The average areal recharge across the entire bioregion was estimated to be 116 mm/year.
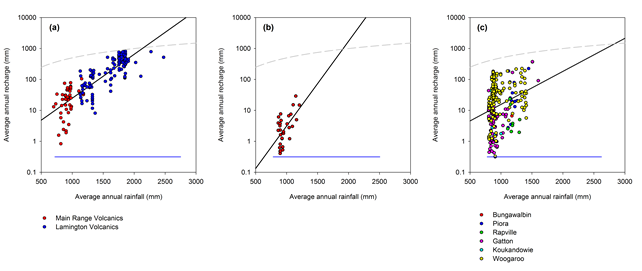
The black line is the line of best fit through the data points, the dashed grey line is recharge as half of rainfall and the blue line is the range of annual average rainfall within the bioregion for the surface geology class.
Data: Bioregional Assessment Programme (Dataset 2)
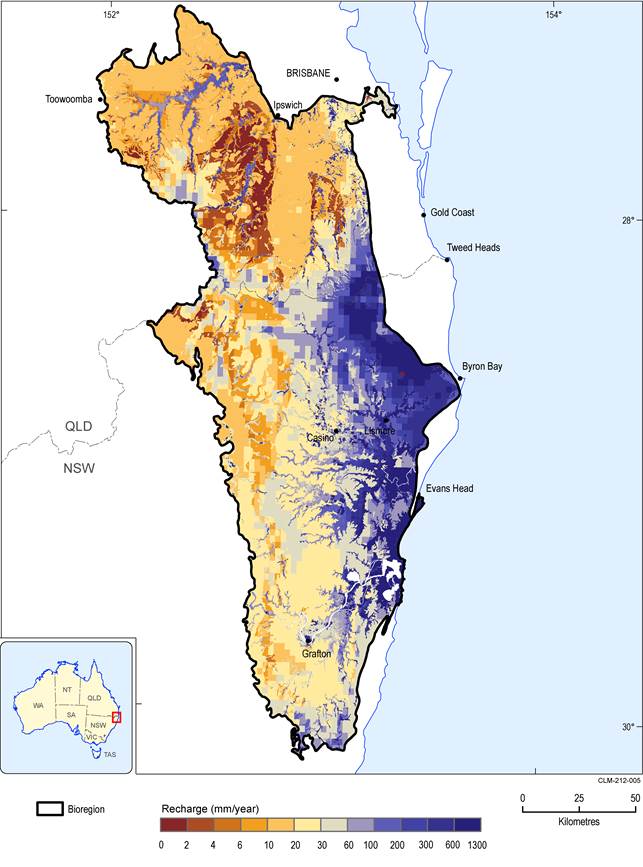
Figure 32 Upscaled estimates of annual average recharge over the bioregion
Data: Bioregional Assessment Programme (Dataset 2)
The deterministic estimate of recharge shown in Figure 32 was used as the base recharge in the numerical groundwater model. However, an estimate of the uncertainty around this deterministic estimate is necessary for carrying out the sensitivity and uncertainty analyses. The sources of uncertainty that can be quantified are the chloride deposition and the regression function. The chloride deposition shown in Figure 33 is the best estimate reported by Leaney et al. (2011), who also produced gridded estimates of the mean, standard deviation and skewness from 1000 equally well-calibrated replicates. These gridded datasets were used to stochastically generate ten alternate chloride deposition grids. Each of these ten deposition grids were used to generate the regression equations between annual average rainfall and annual average recharge using bootstrapping with replacement for ten replicates. This provided 100 replicate regression equations to use in up-scaling (Figure 33).

Each red line is 1 of 100 replicates of the regression equation between annual average rainfall and average annual recharge.
Data: Bioregional Assessment Programme (Dataset 2)
There is a higher uncertainty in the relationships developed for the Walloon Coal Measures compared to the other two classes (Figure 33) due to the lack of data and the spread in the point estimates of recharge. This is then transferred through to the upscaled estimates of recharge (Figure 34). The areally averaged recharge for the 50th percentile of the 100 replicates is 126 mm/year with the 5th and 95th percentiles being 107 and 154 mm/year, respectively.
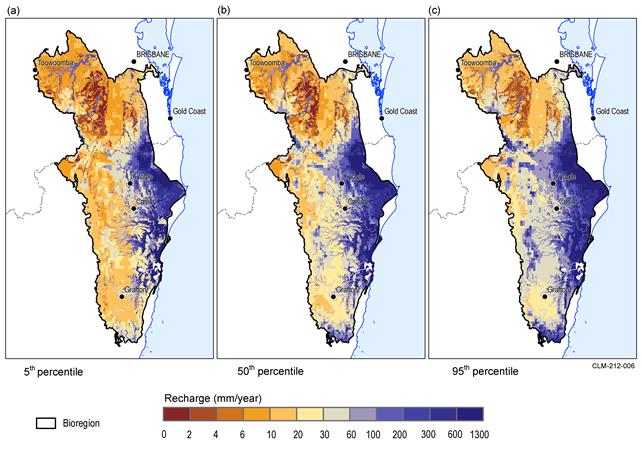
Data: Bioregional Assessment Programme (Dataset 2)
The limitations of the recharge estimation as applied here relate to the assumptions underpinning the methodology. Not accounting for the chloride that is lost from the system through surface runoff leads to overestimating recharge, whereas not accounting for the enhanced deposition on forested areas leads to underestimating recharge. The assumption of steady state conditions is violated in areas that have not attained equilibrium following the clearing of native vegetation for agriculture, which will likely lead to an underestimation of recharge. No attempt was made to quantify the impacts of such forms of uncertainty.
