Following the development of the three-dimensional geological models, isopach maps can be developed to illustrate the spatial variability of the thickness of the stratigraphic units. Isopach maps and/or depth to the ‘formation top’ maps have been presented by O’Brien and Wells (1994) and Ingram and Robinson (1996). However, due to the available new data, particularly from CSG exploration wells, these existing maps do not represent the latest state of knowledge in some areas, as shown by the discrepancy between previously developed isopaches and the thickness indicated by more recent exploration well records (Figure 18).
The three-dimensional geological models developed during this BA will be discussed in detail in companion product 2.3 for the Clarence-Moreton bioregion (Raiber et al., 2016).
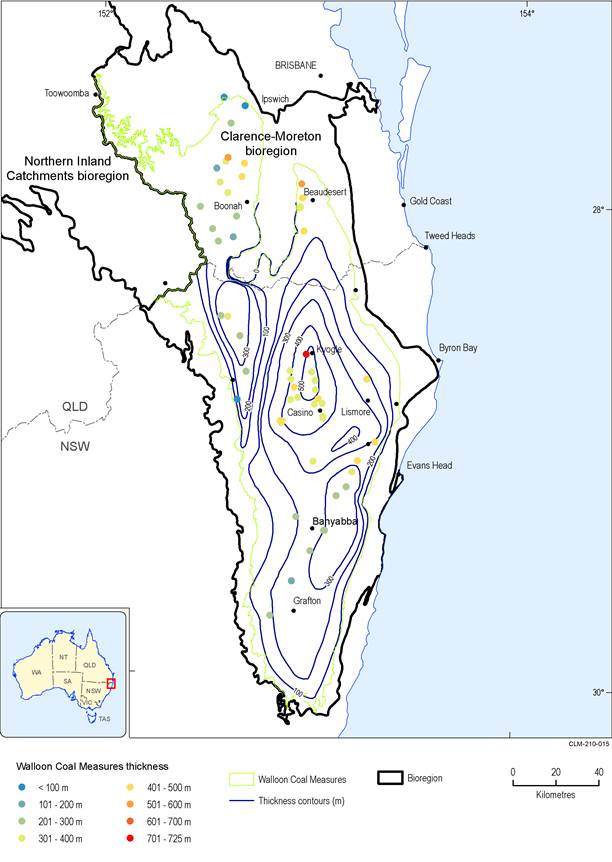
Figure 18 Isopach map showing the thickness of the Walloon Coal Measures
Only wells where the full sequence of the Walloon Coal Measures (i.e. where the formation underneath the Walloon Coal Measures (Koukandowie Formation)) has been intersected are shown.
Data: Bioregional Assessment Programme (Dataset 46), derived from Ingram and Robinson (1996) in relation to the thickness of the Walloon Coal Measures at exploration wells drilled since 1996 (Bioregional Assessment Programme, Dataset 47)
