The spatial representation of the lowest and highest river and stream ECs on record at any site (Figure 63 and Figure 64) highlights that there is considerable spatial and temporal variability of salinities in the different river basins in the bioregion.
Generally for most sites, the lowest observed ECs represent periods of high stream discharge following high rainfall events or prolonged periods of above-average rainfall. For some sites, there is only limited variability between the lowest measured river or stream salinity and the highest salinity measurements. For example, while there is clearly some temporal variability of surface water salinity in the Richmond river basin (Figure 63 and Figure 64), the magnitude of observed variability is comparatively small at most sites. The highest surface water salinities observed in the Richmond river basin (25,400 µS/cm measured at the Richmond River at Woodburn (Figure 64) and up to 68,000 µS/cm at multiple sites in the Clarence river basin) are likely to represent a combination of tidal influence, estuarine mixing and open water evaporation. Saline ocean water enters the lower reaches of rivers during high tides. In these tidally influenced parts of the river, the boundary between fresh/brackish/ocean salinity levels (salt line) can move upstream or downstream. This movement of the salt line depends on the tides themselves, but also on the downstream flow of freshwater in the river. The lower parts of rivers can be fresh, and yet still exhibit tidal influence.
There is a significant difference between the lowest and the highest EC on record in many areas such as the Lockyer Valley, the Bremer river basin and the Warrill creek catchment in Queensland. At some sites, the difference between the lowest and highest salinity measurement on record is more than 10,000 µS/cm. In contrast to the Clarence river basin, there is no tidal influence in the bioregion in Queensland. The observed elevated surface water salinities instead mark the influence of baseflow from stratigraphic units such as the Gatton Sandstone, Walloon Coal Measures and Koukandowie Formation that occurs (all of these typically contain brackish or saline groundwater as discussed in Section 2.1.3.3.3) during periods of low surface water flows.
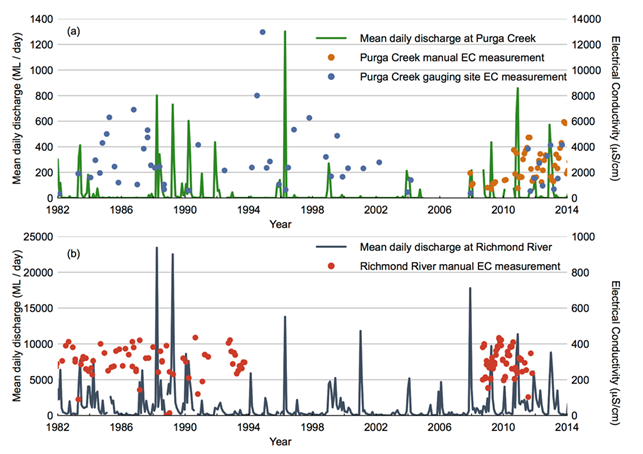
In order to illustrate the influence of low and high stream discharge volumes on river and stream salinity in these catchments, two examples of the temporal variability for Purga Creek in the Bremer river basin and Richmond River at Casino are shown in Figure 65. While the record at these sites is based on irregular measurements, there appears to be a clear relationship between the stream discharge rate and the EC for Purga Creek (Figure 65a). During periods of high flows, the salinity here is typically less than 1,000 µS/cm, but increases to up to 13,000 µS/cm following prolonged periods of low flow, which is in a similar range as the EC in the underlying bedrock (Walloon Coal Measures and Koukandowie Formation). Interestingly, the comparison of manual EC measurements with gauging site EC measurements at this site highlights the limitation of irregular manual measurement, which cannot capture the magnitude of variability to the same degree as regular measurements from automated gauging sites.
While there is also substantial variability of EC for the Richmond River (Figure 65b), the magnitude of this variability is much smaller (most samples range from 200–450 µS/cm) than in Purga Creek. This probably reflects the strong influence of the Lamington Volcanics, which predominantly contain fresh groundwater (Section 2.1.3.3.3), and other bedrock formations such as the Piora Member in this river basin. As these two bedrock formations, which underlie the alluvial aquifers throughout much of the Richmond river basin, predominantly contain fresh groundwater, EC alone may not be sufficient as a tracer of groundwater input into streams. Stream and groundwater surveys of other tracers such as 222Rn would therefore be very useful; such measurements have been recently conducted by Southern Cross University at 29 creek and river sites in the Richmond river basin (Atkins, 2016), confirming the high spatial and temporal variability of surface water – groundwater interaction.
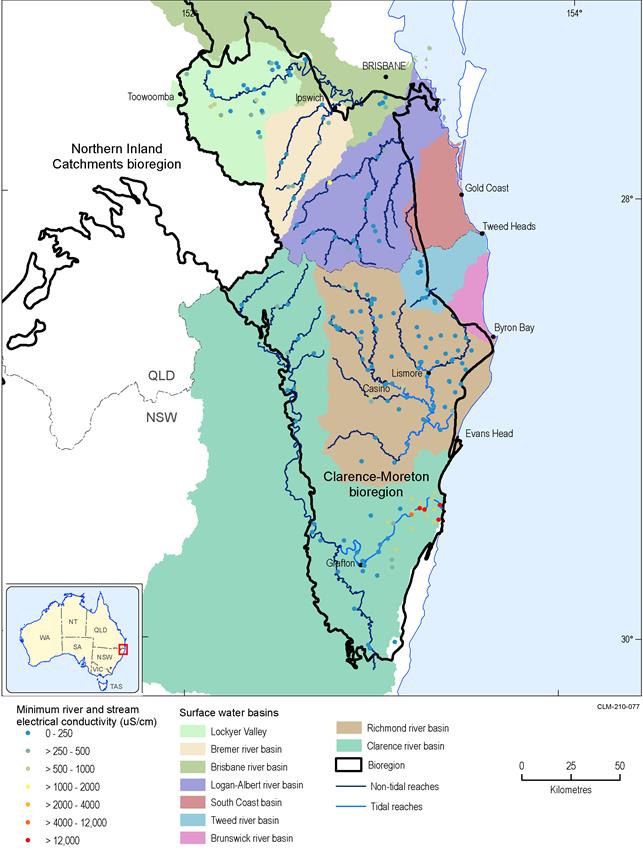
Figure 63 Minimum stream electrical conductivity representing conditions of high streamflow
Data: Bioregional Assessment Programme (Dataset 3)
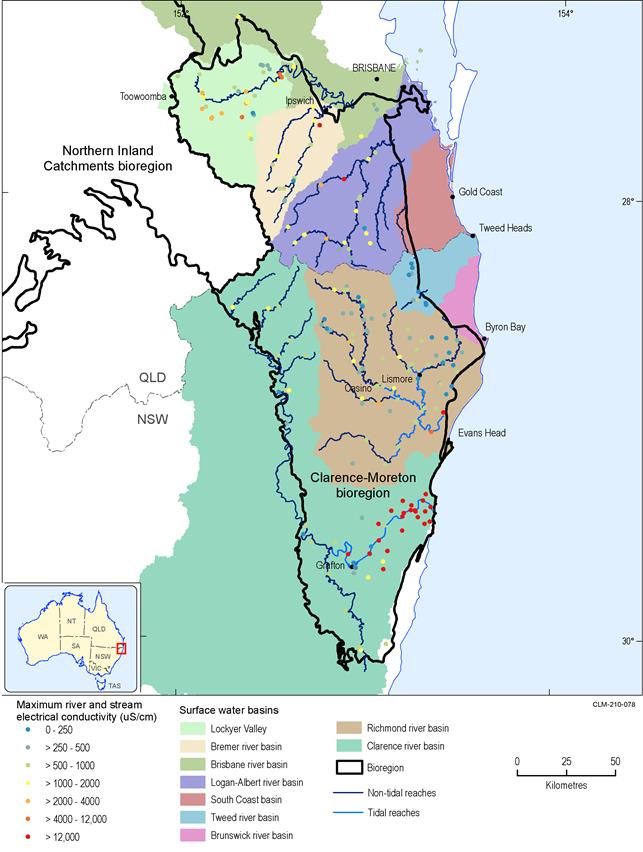
Figure 64 Maximum stream electrical conductivity as representation of low streamflow conditions
Data: Bioregional Assessment Programme (Dataset 3)
Data: NSW Office of Water (Dataset 1), Queensland Department of Natural Resources and Management (Dataset 2)
