The extent of the major stratigraphic units within the Clarence-Moreton bioregion (Figure 6) was constructed in ArcGIS and GoCAD using all available geological information. Geological maps only display the extent of geological units at the surface, but for the development of three-dimensional geological models, shapefiles represent the extent at both surface and in the subsurface and are helpful to guide model development. The recent revision of the stratigraphy of the youngest stratigraphic units within the Clarence-Moreton Basin in NSW proposed by Doig and Stanmore (2012), and adopted by the Geological Survey of NSW, means that the boundaries of some of the younger units have changed. A preliminary new map (not yet officially published) has been provided by the Geological Survey of NSW (Geological Survey of NSW, Dataset 6), and has been used in the Assessment. Additional data sources were used where bedrock stratigraphic units of the Clarence-Moreton Basin (e.g. Walloon Coal Measures) are buried underneath Neogene volcanic rocks (e.g. Lamington Volcanics). Lithological and stratigraphic data from groundwater bores, deep stratigraphic wells, existing two-dimensional cross-sections (e.g. Ingram and Robinson, 1996) and exploration wells were integrated with geological interpretations (e.g. through the construction of many additional cross-sections) in three-dimensional space in GoCAD to determine the likely extent of the stratigraphic units both at the surface and subsurface.
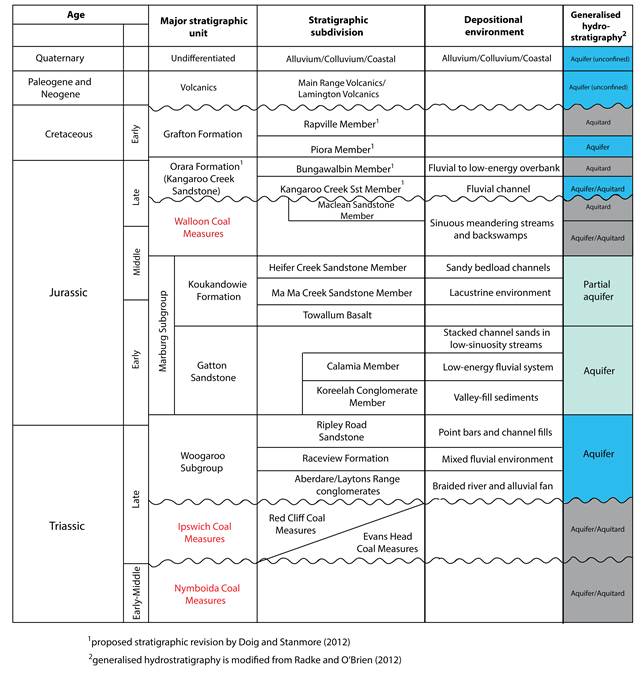
Figure 6 Stratigraphic table of the Clarence-Moreton Basin
This figure is based on Rassam et al. (2014), Doig and Stanmore (2012), Radke and O’Brien (2012) and O’Brien and Wells (1994)
