Groundwater bores
Groundwater bores from the Queensland and NSW groundwater databases are an important source of information on lithological data and have underpinned the development of the three-dimensional geological model. More than 12,000 registered groundwater bores have lithological information in the Clarence-Moreton bioregion (Table 4). The Lockyer Valley in south‑east Queensland has the highest density of groundwater bores with lithological information from more than 5000 bores (Figure 7 and Table 4). The Richmond river basin in NSW has more than 3000 bores with lithological data. The spatial coverage in other river basins such as the Bremer river basin and Warrill creek basin, the Logan-Albert river basin and in particular the Clarence river basin is much poorer, which is attributed to different land uses and/or a stronger reliance on surface water.
Table 4 Groundwater bores with lithological information in the Clarence-Moreton bioregion
na = data not applicable
Data: Bioregional Assessment Programme (Dataset 7, Dataset 8)
Information from the groundwater bores is critical to characterise the contact between the alluvium and the underlying volcanic and sedimentary bedrock. However, its usefulness for developing the formation tops of deeper aquifers is mostly limited. This is indicated by the shallow depths of most groundwater bores. For example, groundwater bores with lithological data in the Lockyer Valley have a median depth of only 27.4 m in comparison to the depth of the Clarence-Moreton Basin which exceeds 2000 m in many parts of Queensland and NSW.
In addition to this depth limitation, there is also a substantial lack of stratigraphic information associated with the groundwater bores. For example, less than half of all bores with lithological data also have stratigraphic data (where depth horizons are assigned to stratigraphic layers) in the DNRM groundwater database (Table 4 and Figure 7), and only six bores have stratigraphic information in the NSW part of the bioregion (Table 4). Bores that lack stratigraphic data are of limited use for the purpose of building the three-dimensional geological model. As this poses a severe limitation, considerable effort has been made by the Assessment team to improve the lithological data, and where possible, stratigraphic data were assigned to the bores. This was possible for most bores in NSW, and the interface between alluvium and underlying bedrock can therefore be well defined in most areas. However, in many cases, ambiguity remains with regards to the assignment of the stratigraphic units for deeper groundwater bores. Following that process, all bores were imported into GoCAD for further data quality assessments, thus paving the way to commence the development of the interface between the alluvial aquifers and the underlying bedrock aquifers. During the development of the three-dimensional geological model, this classification was further improved iteratively.
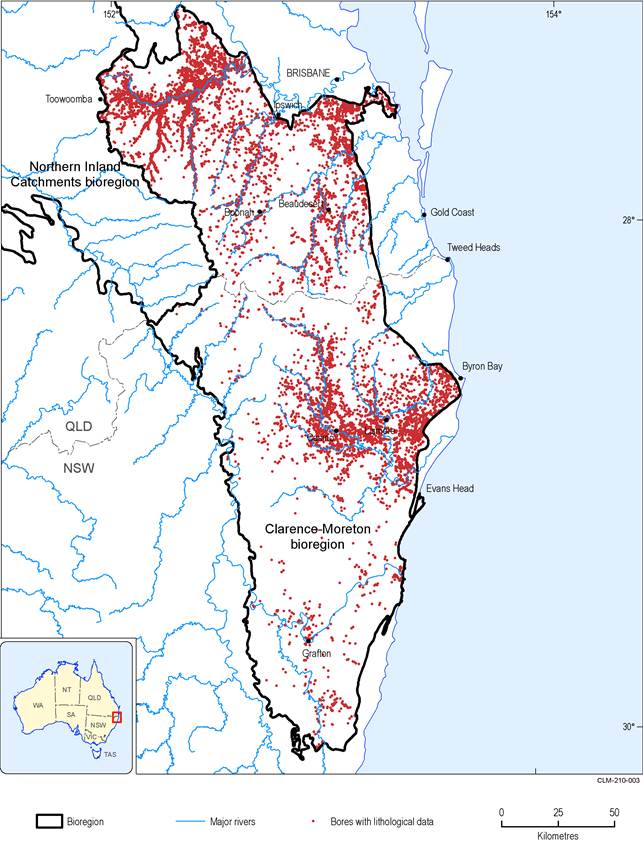
Figure 7 Groundwater bores with lithological data in the Clarence-Moreton bioregion
Data: Bioregional Assessment Programme (Dataset 7)
Stratigraphic wells
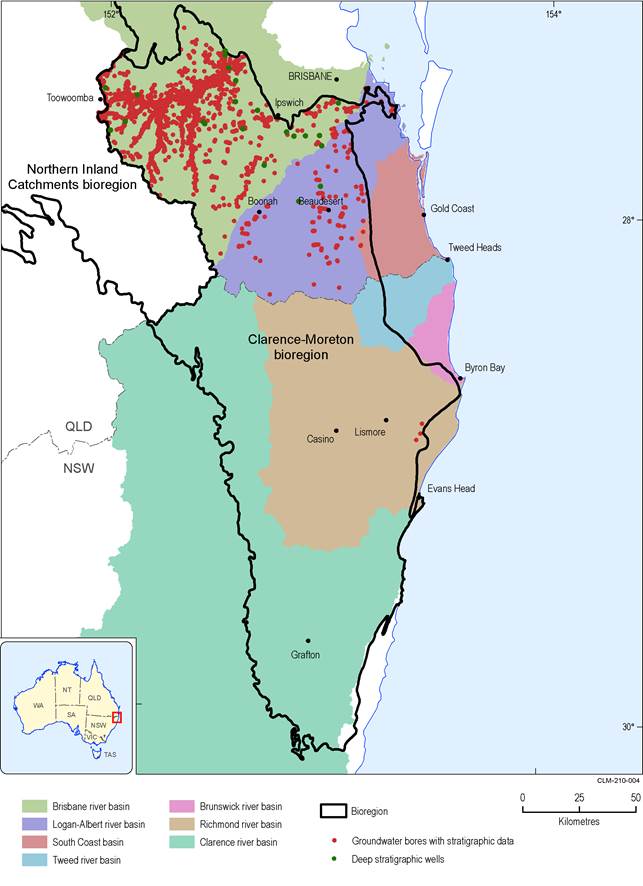
In addition to the groundwater bores, there are also 22 stratigraphic wells in the bioregion (Bioregional Assessment Programme, Dataset 9). These were drilled as part of a programme to improve the understanding on the character and depth of the sedimentary sequences in the Clarence-Moreton Basin as described in O’Brien and Wells (1994). With a maximum depth of more than 1000 m and a mean depth of more than 400 m (Table 5), these wells are substantially deeper than most groundwater bores. In addition, the quality of the stratigraphic information from these wells is much better than the quality of groundwater bore log descriptions, and several of these deep stratigraphic wells penetrate the entire sedimentary sequence of the Clarence-Moreton Basin and intersect the underlying basement. These data therefore provide an important source of information on the subsurface distribution and thickness of the stratigraphic units of the Clarence-Moreton Basin.
Data: Bioregional Assessment Programme (Dataset 8, 9)
Exploration wells
In addition to the stratigraphic wells mentioned above, exploration wells are another important data source for the construction of the formation tops that have underpinned the development of the three-dimensional geological model.
The different exploration well types in the bioregion are:
- CSG exploration, trial or pilot wells
- petroleum or conventional gas exploration wells
- coal exploration wells
- mineral exploration wells.
Coal seam gas exploration wells
Stratigraphic data were collated from wells that originated from various sources. There are 39 CSG wells in the Queensland part of the Clarence-Moreton bioregion and 74 in the NSW part (Bioregional Assessment Programme, Dataset 10), with most wells drilled in the last 10 to 15 years predominantly by Metgasco and Arrow Energy Pty Ltd (Arrow Energy). Well completion reports were downloaded from the DNRM QDEX database and the NSW Department of Trade and Investment DIGS®database. In addition, unpublished well completion reports were provided by Metgasco. With mean depths of 551 m and 782 m, and maximum depths of 1052 m and 1522 m in Queensland and NSW, respectively, these wells significantly enhance the understanding of the subsurface geometry. Resulting from the new data from CSG exploration wells, there has also been a revision of the stratigraphy of the youngest bedrock units of the Clarence-Moreton Basin in NSW (Doig and Stanmore, 2012). Most of these CSG exploration wells have targeted CSG resources within the Walloon Coal Measures, but some wells were also drilled to explore the CSG potential of the older Ipswich Coal Measures (Figure 9). In addition to the data from the CSG well completion reports, a spreadsheet with formation tops re-interpreted to account for the revised stratigraphy was provided by Metgasco, forming one of the key data sources for the development of the three-dimensional geological model (Metgasco Limited, Dataset 11).
Petroleum and conventional gas exploration wells
Petroleum and conventional gas exploration in the bioregion commenced decades ago. There are currently 26 petroleum/conventional gas exploration wells in Queensland (most of which were drilled prior to 1990) and 24 in NSW (Bioregional Assessment Programme, Dataset 10). Despite being fewer than the CSG exploration wells, they are considered an important source of information for understanding subsurface aquifer geometry. Due to the considerable depth of some of those wells (Table 5) that extend as deep as 2490 m in NSW at Kyogle 1, and together with seismic data, they are considered the most important data source for constructing formation tops of the deeper stratigraphic units in the Clarence-Moreton Basin (e.g. Gatton Sandstone and Woogaroo Subgroup).
Table 5 Exploration and stratigraphic wells in the Clarence-Moreton bioregion in Queensland
na = data not applicable
Data: Bioregional Assessment Programme (Dataset 9, Dataset 10, Dataset 12). In addition, information from publications (e.g. O’Brien and Wells (1994) and Ingram and Robinson (1996)) is also considered.
Table 6 Exploration and stratigraphic wells in the Clarence-Moreton bioregion in NSW
na = data not applicable
Data: Bioregional Assessment Programme (Dataset 9, Dataset 10, Dataset 13) . In addition, information from publications (e.g. O’Brien and Wells (1994) and Ingram and Robinson (1996)) is also considered.
Coal exploration wells
There are 670 coal exploration wells in the bioregion, of which 576 are in Queensland (Bioregional Assessment Programme, Dataset 12) and 94 in NSW (Bioregional Assessment Programme, Dataset 13) (Table 5 and Table 6). In comparison to the CSG, petroleum and conventional gas exploration wells, these are considered less useful for developing the three-dimensional geological model because
- They are typically shallower and most of them only target the uppermost 50 to 100 m of the Walloon Coal Measures or Ipswich Coal Measures at the shallow margins of the Clarence-Morton Basin.
- For most of them, there are only lithological data with no stratigraphic descriptions available.
- They often only target one formation and do not intersect the underlying formation, hence, the only useful information that can be derived is the minimum depth of the target formation.
- The quality of the well completion reports is poorer compared to those for CSG and petroleum wells, with no digital records of logs.
Nevertheless, the well completion reports for the coal exploration wells were obtained from the DNRM QDEX and the NSW Department of Trade and Investment DIGS® databases and, with a focus on the deeper coal exploration wells, any useful information was extracted.
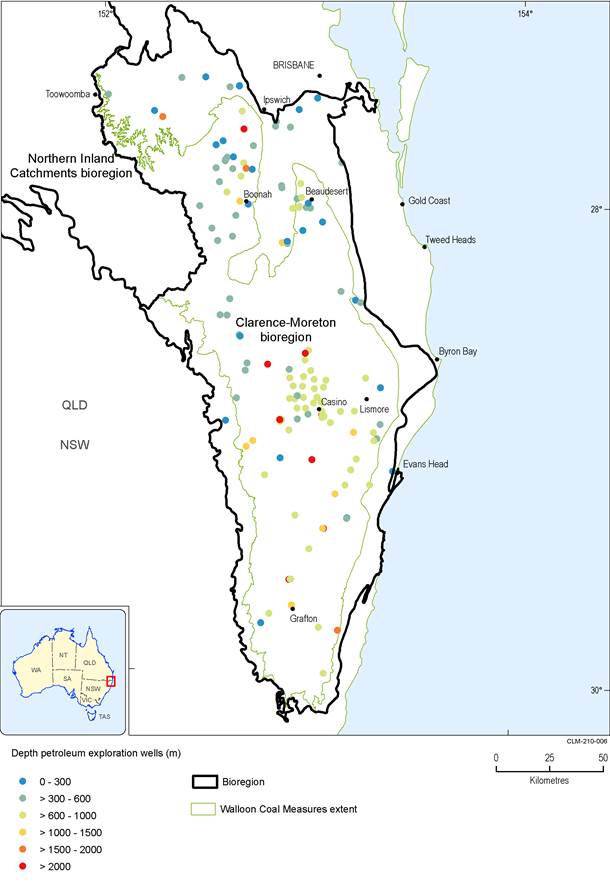
Figure 9 Spatial distribution and depth of coal seam gas and petroleum exploration wells
Wells drilled outside the boundary of the Walloon Coal Measures target the deeper and older coal of the Ipswich Coal Measures Data: Bioregional Assessment Programme (Dataset 10)
Mineral exploration wells
In contrast to CSG, petroleum and coal bores, there are no geographic information system (GIS) datasets available from the Queensland IRTM system or NSW Geoscience Information Services that show the location and depth of the mineral exploration bores in the bioregion. Instead, there is a shape file that shows all mineral exploration projects within a specified area. It was therefore necessary to assess each project report individually to search for useful data. Most of the mineral exploration data in the bioregion appeared to be of limited use due to the shallow depth of the bores and/or the lack of stratigraphic descriptions. However, a final report on Exploration Licence 4430 by BHP Minerals (Darby, 1993; Torr, 1994) contained very useful lithological logs of approximately 113 shallow bores in the Bungawalbin Creek in the southern Richmond river basin, an area that has little data in the NSW groundwater database. These data were then manually entered into the database (Bioregional Assessment Programme, Dataset 14) and combined with the groundwater bore dataset to improve the definition of the interface between the alluvial aquifer and the underlying bedrock.
