Assigning a bore to a specific aquifer is underpinned by the screened interval data and the aquifer boundaries. In many cases, it is impossible to assign the screened interval of a bore to a single aquifer as bores are either screened across different aquifers or there is insufficient information on stratigraphy and screened intervals. The National Groundwater Information System (NGIS) groundwater database (Bureau of Meteorology, Dataset 1) contains only limited stratigraphic data for groundwater bores in the Clarence-Moreton bioregion. Therefore, an independent assessment of the stratigraphy boundary was conducted during the Clarence-Moreton Bioregional Assessment (the Assessment) (as described in Section 2.1.2.2.1). Following this stratigraphic assessment for the Clarence-Moreton bioregion in NSW, and after a quality check of the data from the Queensland groundwater database (Bioregional Assessment Programme, Dataset 2), bores were assigned to aquifers by comparing their screen intervals and depth with aquifer boundary data. Furthermore, a code was used for each bore to indicate the spatial relationship between the source aquifer and screen intervals.
The following steps were followed during the aquifer assignment:
Queensland
- Determine the boundary of the aquifer of interest. The ‘Aquifer’ table in the Queensland Department of Natural Resources and Mines (DNRM) database registers aquifers that a bore intersects when it is drilled and records the upper and lower extents of aquifers. This information was used to identify the aquifer boundary at any specific location. When boundary information was missing the ‘Stratigraphy’ table was used to identify aquifer boundaries instead.
- Determine the screen interval of bores. The ‘Casing’ table contains the screen information for most bores in the database. The codes ‘PERF’ (perforated), ‘SCRN’ (screen) and ‘ENDD’ (open end pipe considered as an entry point) in the column ‘MATERIAL’ indicate water entry locations. The code ‘OPEN’ indicates that a bore is uncased at some depths; if bores intersect an aquifer, then they are considered as water supply points. These codes were used to find the screen interval of a bore. When multiple screens exist, the bore is assumed to be screened across the entire length of the individual screens.
- Determine the screen code. A bore may tap into an aquifer in four ways depending on its screen location in aquifers. Four codes (I, T, B and E; abbreviations are explained in the figure caption of Figure 19) were used to indicate the different spatial relationships of a bore with its targeted aquifer (Figure 19). When screen information is lacking, bores with their lower ends located in an aquifer are assumed to be tapped to that aquifer and were assigned a screen code ‘BOI’ (Figure 19).
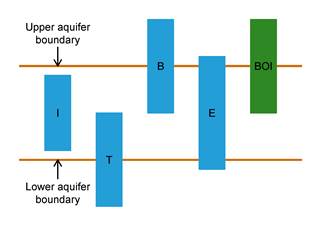
Figure 19 Diagram showing the spatial relationship between aquifer boundaries and screen intervals
(I) the screen interval is within the aquifer; (T) the top of the screen interval is within the aquifer; (B) the bottom of the screen interval is within the aquifer; (E) the bore screen penetrates the entire aquifer; (BOI) there is no screen information in the database, but the bore bottom is located within the aquifer
- Filter bores for a specific area using a shape file or coordinates. If only a part of the aquifer is of interest, then the bores can be filtered based on their locations.
- Cross-check the final datasets against expert knowledge and spatial context of aquifers. Any errors that remain following extensive data quality checks can be highlighted during data interpretation and visual representation and can subsequently be corrected through an iterative process.
New South Wales
- Assess the boundaries of aquifers as outlined in Section 2.1.2.1.6.
- Determine the screen intervals of bores. The screen information was extracted from the ‘Construction’ table in the Bureau of Meteorology (Dataset 1) groundwater data archive. The keywords ‘OPENING’ and ‘HOLE’ were used to calculate screen intervals. For example, for the bores in Table 9, GW102905, GW004084 and GW410337 have screen intervals of 12 to 30 mBGL, 80.7 to 115.7 mBGL and zero to 3.05 mBGL, respectively. The bore depth information was extracted from the NSW Water Data Transfer Format (WDTF), Hydstra, and the Bureau of Meteorology (Dataset 1) dataset. For bores without depth information in these databases, the bore depth calculations were based on the construction information.
- Filter bores for a specific area using a shape file or coordinates.
- Cross-check the final datasets against expert knowledge, the spatial context of aquifers and the 3D geological model.
Table 9 Sample data to show the algorithm used to determine the screen interval
mBGL refers to metres below ground level
Data: Bureau of Meteorology (Dataset 1)
