Groundwater recharge sourced from rainfall is a crucial input into numerical groundwater models. There have not been previous estimates of recharge in the Clarence-Moreton bioregion at a scale suitable for the numerical modelling that will be carried out in this bioregion. Hence, recharge was estimated using the chloride mass balance method (Anderson, 1945). This simple and cost-effective method for estimating recharge is the most commonly used method in Australia due to the availability of data that supports it (Crosbie et al., 2010).
The assumptions that underpin the chloride mass balance method may be summarised as follows (Wood, 1999):
- Chloride in groundwater is only sourced from rainfall (not rock weathering or interactions with streams or deeper aquifers).
- Chloride is conservative in the system (no sources or sinks).
- The chloride flux does not change over time (steady state conditions).
- There is no recycling of chloride in the system (e.g. due to irrigation drainage).
If these assumptions are met, then recharge can be estimated as follows:
|
|
(1) |

where the recharge (R) is in mm/year, the chloride deposition (D) is in kg/ha/year and the chloride concentration of groundwater [Cl-]gw is in mg/L.
For the Clarence-Morton bioregion these assumptions have an impact on the ability to estimate recharge. In alluvial areas, additional chloride originating from streams as well as upward flow from deeper aquifers violates the first assumption. Similarly, recharge could not be estimated where the screen was not in the same aquifer as the surface geology due to potential leakage from overlying stratigraphic units. Bores in these areas were excluded from further analysis. There is no evidence of any halite or other significant mineral deposits of chloride so the second assumption is valid. There is not enough information on the temporal characteristics of chloride deposition to determine if the deposition is in steady state, but the effects of land use change could cause some issues. As the area was cleared over a century ago, and the bores used for the chloride mass balance estimation are shallow, it is assumed that the groundwater samples are representative of the current land use. Areas identified as being under irrigation were excluded due to the recycling of chloride which would violate the fourth assumption. Direct runoff from the surface was not accounted for in the recharge estimations; this will lead to an overestimation of recharge. The enhanced deposition of chloride on tall vegetation (trees) was also not accounted for, resulting in an underestimation of recharge. Although neither process has been accounted for, they are expected to be of the same order of magnitude in error (10–30%) in opposing directions. As they could not be quantified they have not been included in the uncertainty in the recharge estimates.
The chloride deposition over the Clarence-Moreton bioregion extracted from the national dataset at a resolution of 0.05° (Leaney et al., 2011) shows that chloride deposition is much greater near the coast compared to inland areas (Figure 20). Within the Clarence-Moreton bioregion, there were approximately 4000 points with chloride data available where it was possible to assign the bore to an aquifer based on the screen location (Figure 19). After excluding those bores in alluvial and confined areas, there were only 374 valid point estimates of recharge which were not uniformly distributed across the spatial extent of the bioregion (Figure 20).
As the numerical model requires a continuous surface of recharge estimates, the point estimates derived from the chloride mass balance needed to be upscaled. It has been shown by Crosbie et al. (2010) that annual average rainfall, soil type and vegetation type are the key determinants of recharge and had been previously used to upscale point estimates (Crosbie et al., 2013). However, the paucity of data in this region led to using annual average rainfall across three different classes of surface geology as co-variates. Those classes were chosen because: Cenozoic volcanics have higher recharge rates for a given rainfall compared to other rock types; Walloon Coal Measures are of interest as their outcrop areas recharge and replenish the aquifer following the cessation of CSG pumping; all other rock types were combined due to a lack of data needed to distinguish between them.
A log-linear relationship was adopted for estimating annual average recharge from annual average rainfall. This is similar to relationships developed previously from both field and modelled data (Crosbie et al., 2013; Crosbie et al., 2010). At the higher end of the rainfall spectrum (especially when extrapolated beyond the range of the field data), the log-normal relationship can predict recharge rates that are much greater than rainfall. To prevent this happening, a global maximum recharge rate equal to half the rainfall has been imposed; this is approximately the highest recharge estimated from the point scale chloride mass balance estimates. As the chloride mass balance method was not appropriate for alluvial areas, empirical relationships developed from historical field data to predict recharge using average annual rainfall, soil clay content and vegetation were used (Wohling et al., 2012).
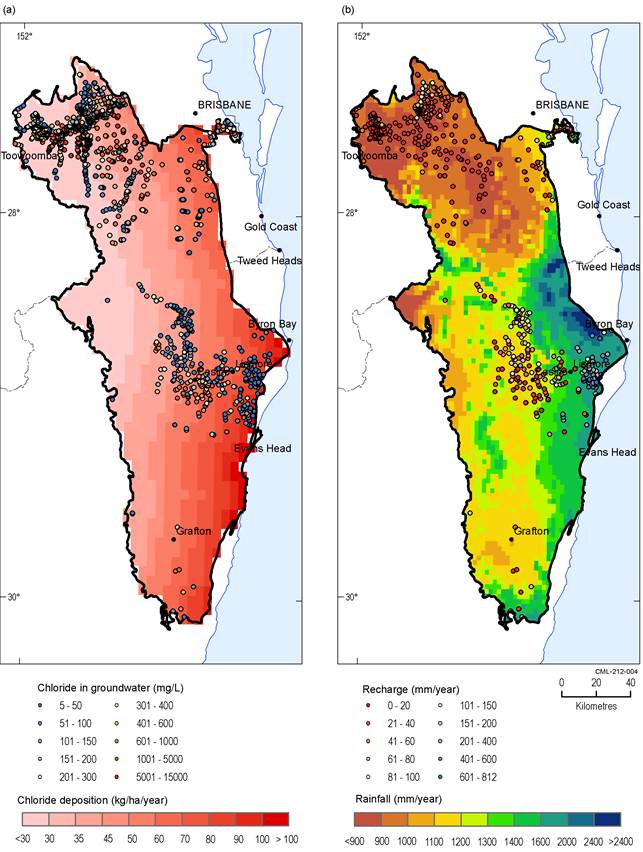
Figure 20 Inputs into the chloride mass balance method
Left panel (a) showing the chloride deposition and the chloride concentration of the groundwater over the surface geology type and the right panel (b) showing the annual average rainfall and the point estimates of recharge (excluding points on alluvium)
Data: Bioregional Assessment Programme (Dataset 2)
