The data sources used for the three-dimensional geological model have been described in previous sections. A certain surface may be well constrained in some parts of the model domain but poorly constrained or even absent in others due to a lack of data. To overcome this limitation, the depth maps created using kriging (Figure 13 to Figure 17) were used in data-poor areas such as the Clarence river basin and in the headwaters of alluvial systems where the data coverage is generally sparse to represent the ‘base of alluvium’ horizon in the three-dimensional geological models. In data-rich areas such as the Lockyer Valley or the central Richmond River floodplain, additional control points were digitised in GoCAD™ (Paradigm Geophysical Pty Ltd, version 2009.4) using regular sets of cross-sections (constructed using the GoCAD add-on module ‘Mining Utilities’ from Mira Geosciences) to avoid model artefacts and to guide the shape of the horizon.
Richmond River alluvium
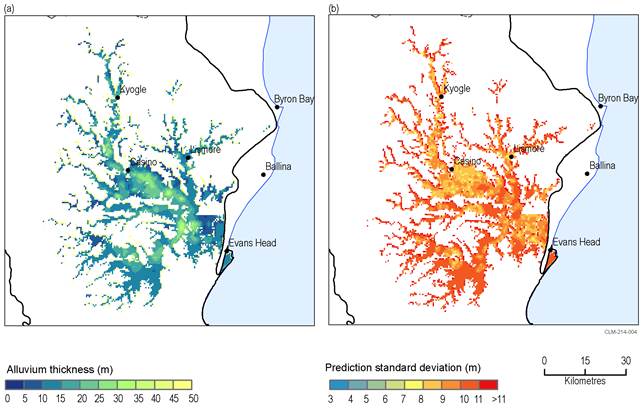
As shown in Table 4, there are 3309 groundwater bores with lithological data in the Richmond river basin. After cleaning these data and converting the lithological data into stratigraphic logs where possible, these data were used to create a surface that represents the depth to the base of the alluvium, and thus, the interface with the underlying bedrock. This can then be converted to a surface representing the elevations that underpin the three-dimensional geological model by relating it to the topography (derived from the SRTM data). Figure 13 shows that the depth of the Richmond River alluvial system is mostly less than 30 m in the centre of the alluvium of the Richmond River drainage line, with local thicknesses of up to approximately 45 m.
The headwater alluvial systems within the Lamington Volcanics as well as smaller tributary systems in the southern part of the Richmond river basin are typically thinner and mostly less than 15 to 20 m. The shape of these smaller systems (usually v-shape) also differs from the wider central drainage line of the Richmond River (u-shaped).
Data: Bioregional Assessment Programme (Dataset 29)
Clarence River alluvium
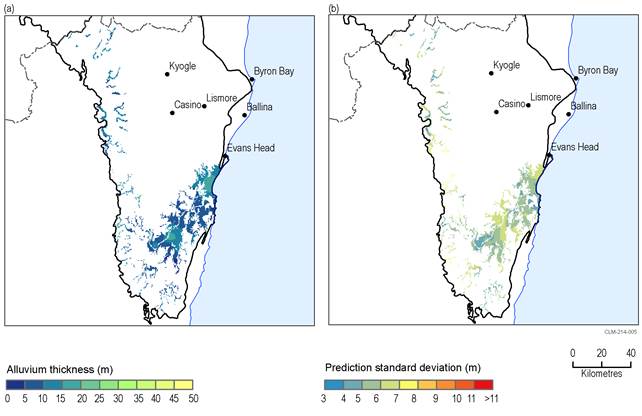
As outlined in Section 2.1.2.2.1, there are 474 groundwater bores with lithological data and no groundwater bores with stratigraphic data available in the Clarence river basin. Consequently, the uncertainty associated with the spatial interpolation is very high in the Clarence river basin (Figure 14), as indicated by a standard deviation of nearly 50% of the thickness of the alluvium. Based on this limited knowledge, the Clarence River alluvium appears to be considerably thinner than the Richmond River alluvium.
Data: Bioregional Assessment Programme (Dataset 29)
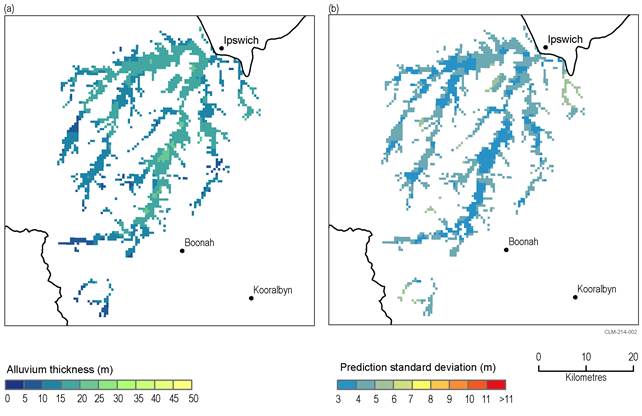
Lockyer Valley alluvium
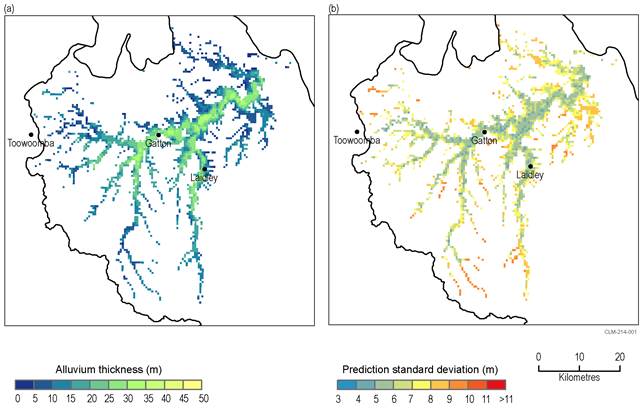
With lithological logs available for more than 5000 groundwater bores, the Lockyer Valley alluvial system is the best constrained alluvial system in the bioregion. Accordingly, the standard deviation associated with the spatial interpolation is considerably smaller relative to the thickness of the system compared to other alluvial systems such as the Clarence River alluvium (Figure 15).
The thickness of the Lockyer Valley alluvial system generally varies between 20 to 35 m throughout much of the central drainage line of Lockyer Creek. Towards the edges, the alluvium is thinner. In major tributary systems such as Laidley Creek and the lower reaches of other creeks such as Tenthill Creek, the thickness of the alluvial systems is similar (20 to 30 m). In the headwaters, most tributary systems of Lockyer Creek have considerably thinner and narrower alluvial systems, generally ranging from approximately 5 to 15 m.
Data: Bioregional Assessment Programme (Dataset 29)
Logan-Albert alluvium
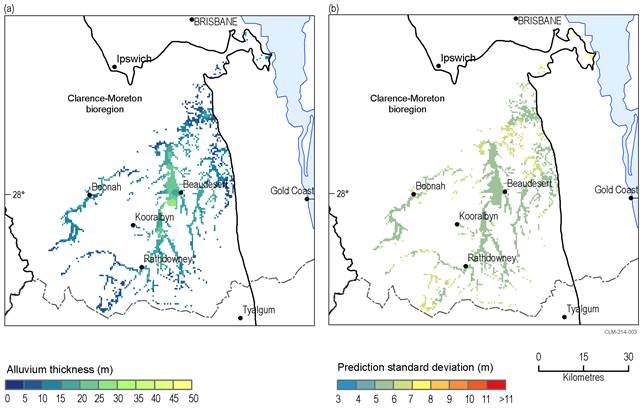
The depth to the base of the Logan-Albert alluvial system is based on 1550 groundwater bores (Table 4). The thickness of the Logan-Albert alluvial system (Figure 16) is more variable than the Lockyer Valley or the Richmond River alluvial systems. Where the floodplain is widest in the central part of the river basin, the alluvial sediments reach a thickness of approximately 30 m. However, throughout much of the Logan-Albert river basin, the thickness of the alluvial sediments typically ranges between 5 to 20 m. Due to the large size of the catchment and the relatively small number of data points, the standard deviation associated with the kriging interpolation is comparatively high.
Data: Bioregional Assessment Programme (Dataset 29)
Bremer River alluvium
The surface of the depth to the base of the Bremer River and Warrill Creek alluvial system is based on 862 groundwater bore lithological logs (Table 4). In comparison to the neighbouring Lockyer Valley, the uncertainty associated with the prediction is higher in the Bremer river basin (Figure 17) as indicated by a higher standard deviation relative to the thickness of the alluvium. The wider parts of the floodplain of the Bremer River and Warrill Creek alluvial systems are up to about 25 to 30 m thick. No distinct thinning of the alluvial aquifer systems can be observed towards the edge of the alluvium, indicating that the interface between the alluvium and the underlying bedrock is relatively steep. The alluvial systems of the Bremer River and Warrill Creek are relatively wide in comparison to other systems such as those in the Lockyer Valley. This is probably a reflection of the topography, which is typically flat or gently undulating throughout most of the Bremer river basin. Similar to other alluvial systems in south-east Queensland and north-east NSW, the alluvial aquifer systems in the Bremer river and Warrill creek basins are typically less than 15 m thick.
Data: Bioregional Assessment Programme (Dataset 29)
Comparison of alluvia within the Clarence-Moreton bioregion
Overall, this analysis indicates that the thickness of the alluvial systems in the Clarence-Moreton bioregion varies within a relatively small margin, whereas the width of the floodplain is highly variable. In effect, in all alluvial systems in the bioregion, the maximum thicknesses that have been observed from bore logs are approximately 30 to 40 m. This is in strong contrast to other alluvial systems further to the west, for example the Condamine River alluvium, which is approximately 130 m thick (Dafny and Silburn, 2014).
Base of basalt horizon
The primary data used to develop the ‘base of basalt’ horizon (representing the base of the Lamington Volcanics and the Main Range Volcanics) are picks from groundwater bore or exploration well data where the interface between the basalt and the underlying sedimentary bedrock was intersected. As these picks are very sparse in some areas, additional control points were digitised along regular sets of cross-sections to avoid model artefacts and horizon cross-overs.
