The national geophysics dataset fully covers the Clarence-Moreton bioregion with magnetic, radiometric and gravity datasets. However, the usefulness of these geophysical datasets for this project is limited to the identification of regional-scale geological structures due to the coarse resolution. Apart from these national geophysical survey datasets, the Clarence-Moreton bioregion has some of the poorest coverage of site-specific airborne geophysical data in Queensland with only one available survey. In NSW, the Grafton – Tenterfield Airborne Geophysical Survey was released in 2012. In addition to the gridded geophysical datasets downloaded from the Geophysical Archive Data Delivery System (GADDS), more geophysical data compilations are available for the bioregion in NSW. Data packages containing geophysical data that were obtained from the Geological Survey of NSW (NSW Office of Trade and Investment) and are used in the Assessment are:
- Onshore Clarence-Moreton Basin - Petroleum Data Package
- Clarence-Moreton Basin - Geophysical Data Compilation
- Clarence-Moreton SEEBASETM and Structural GIS Project (NSW Department of Primary Industries, Dataset 3)
- Clarence-Moreton Basin Seismic Survey 2008
- Grafton - Tenterfield Airborne Geophysical Survey
Geophysics (magnetic, radiometric and gravity)
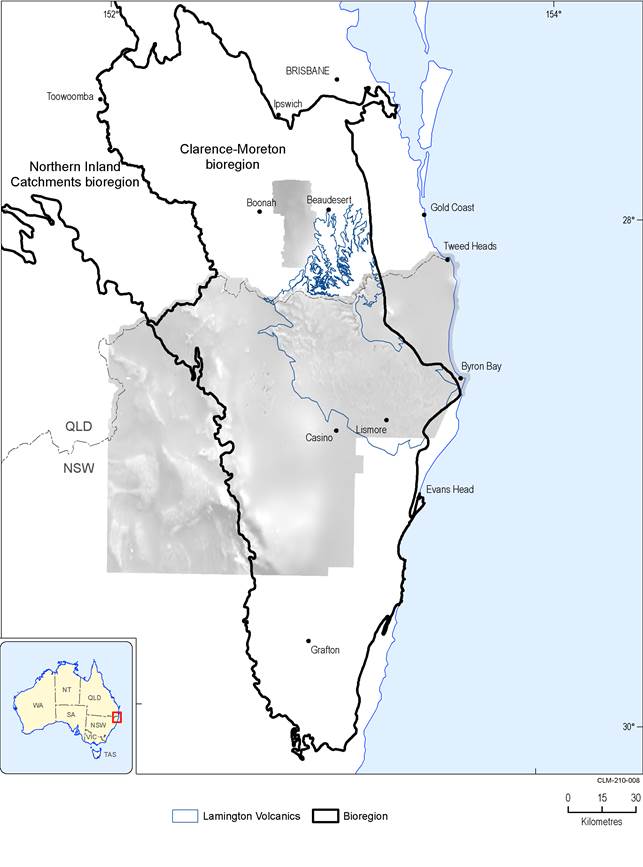
Figure 11 shows the airborne geophysical data in the Clarence-Moreton bioregion. The geophysical data available for the bioregion include numerous sets of magnetic, gravity and radiometric data. Overall, the usefulness of some of these datasets for building the three-dimensional geological model or the identification of new additional structural features seems to be limited due to their coarse resolution. However, the recent Grafton – Tenterfield airborne geophysical survey which covers the northern part of the bioregion in NSW has a considerably finer resolution. It has collected magnetic, gamma-ray and digital terrain data within parts of the mineral-prospective New England Orogen and the Clarence-Moreton Basin. This survey allows, for example, the differentiation of the Lamington Volcanics that are visible as a magnetic anomaly.
Data: Bioregional Assessment Programme (Dataset 17)
Geophysics (seismic reflection)
Apart from the stratigraphic data from exploration bores and stratigraphic bores, seismic data are the most important source of information underpinning the geometry of aquifers in the subsurface. In addition, seismic data allow the determination of vertical displacements of stratigraphic units along faults. Seismic data can also provide information on the internal architecture and disposition of sedimentary rock formations in the subsurface. Seismic data are available in the Clarence-Moreton bioregion as follows:
- There are 706 km of seismic lines acquired as part of nine individual seismic surveys in the bioregion in Queensland (Figure 12) (Bioregional Assessment Programme, Dataset 18). Most of these were collected during the 1960s to 1980s and would require substantial reprocessing prior to any use in this project. However, seismic data for the most recent survey (‘Boonah’, acquired by Arrow Energy in 2000) have been acquired from the Geological Survey of Queensland.
- There are 249 seismic lines with a total line length of 2471 km in NSW (Figure 12) (Bioregional Assessment Programme, Dataset 19). As in Queensland, many of these seismic surveys were conducted in the 1960s to 1980s. However, there are also more recent surveys conducted by Metgasco in addition to reprocessing the results of older datasets.
In combination with the stratigraphic records from exploration and stratigraphic wells, grids which incorporate seismic interpretations provided by Metgasco (Metgasco Limited, Dataset 4) and the NSW Department of Trade and Investment (Dataset 5) for the NSW part of the Clarence-Moreton bioregion were used as data inputs to build the three-dimensional geological model in NSW (Figure 8). In particular, this helped to understand aquifer geometry and understand the extent and type of structural disruption, which may cause direct stratigraphic contact between aquifers and aquitards.
These two datasets included grids of the following layers (covering all or parts of the Clarence-Moreton bioregion in NSW):
- Metgasco Limited formation top grids (Dataset 4): top of the Kangaroo Creek Sandstone, top of the Richmond coal seams (i.e. the top of the coal seams in the Walloon Coal Measures), top of Koukandowie Formation (only partially covering the NSW part of the Clarence-Moreton bioregion) and Gatton Sandstone (only partially covering the NSW part of the Clarence-Moreton bioregion).
- NSW Department of Trade and Investment formation top grids (Dataset 5): top Walloon Coal Measures (i.e. top of the Richmond coal seam), top Gatton Sandstone, top Ripley Road Sandstone (part of the Woogaroo Subgroup), top Ipswich Coal Measures, top Nymboida Coal Measures and top of Basement.
No pre-existing formation top grids or seismic interpretations or picks existed for any of the shallower layers in NSW (i.e. any stratigraphic units younger than the Kangaroo Creek Sandstone) or for any stratigraphic units in Queensland. More detail on how these existing layers were used to inform the three-dimensional geological model is shown in Figure 8 and Section 2.1.2.3.3.
