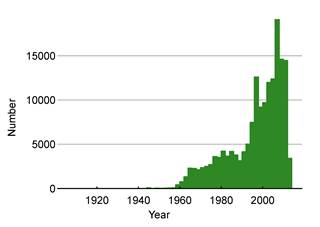
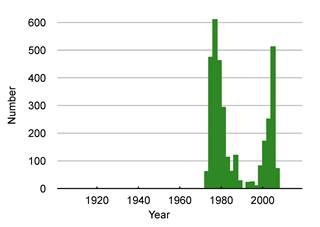
A summary of the measured groundwater level data used in this analysis is in Table 11 . There are more observed data for Queensland than for NSW, and 94.5% of the records are from alluvial bores. Two histograms show the temporal distribution of the water level data (Figure 29 and Figure 30). In Queensland, most measurements were conducted between 1995 and 2012. However, there are two clusters of records for NSW: (i) between 1975 and 1985, and (ii) between 2000 and 2008. The groundwater level data (in metres with respect to AHD) were derived from groundwater depth measurements (in metres below ground surface) in the state databases together with the Australian 1-second DEM data.
Table 11 Summary of groundwater level records for bores in the Clarence-Moreton bioregion
Bores with different screen codes have been counted separately.
NA = data not available
Screen codes are: (I) bores with screen intervals inside the aquifer; (T) bores with a screen top inside the aquifer; (B) bores with a screen bottom within the aquifer; (E) bores with screen intervals penetrating the entire aquifer; (BOI) bores with their bottom inside the aquifer although without screen information in the database; (DS) aquifer assignment for a bore sourced directly from the state database where the bore is only open to a single aquifer; (DM) aquifer assignment for a bore sourced directly from the state database where the bore is screened to multiple aquifers.
Data: Bioregional Assessment Programme (Dataset 4)
Data: Bioregional Assessment Programme (Dataset 5)
Data: Bioregional Assessment Programme (Dataset 6)
