The statistical analysis covers two periods: a period representing drought conditions (from 2000 to 2007) and a period during which the drought broke (from 2008 to 2012) (Figure 35). The temporal and spatial variability of water levels, the primary groundwater flow direction, and the response of aquifers to dry conditions and recovery from the drought were assessed and presented by hydrographs, contours and summary statistics.
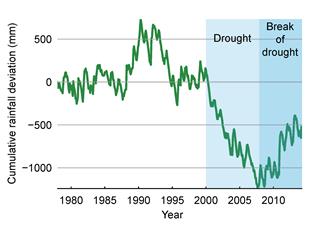
Data: Bioregional Assessment Programme (Dataset 11)
The comparison of the groundwater level response to rainfall events and long-term climate events such as droughts can provide useful information about the pattern of groundwater recharge of aquifers. Figure 36 shows a variable response of groundwater levels to rainfall events of five representative bores in different aquifers in the Clarence-Moreton bioregion. Bores in the same aquifer can show different responses depending on screen depth, local hydrogeological condition and water usage, although these bores may indicate general trends of response.
- The hydrograph of bore RN14320090 (screened in the alluvial aquifer of the Lockyer Valley less than 20 m away from Lockyer Creek) responds very rapidly to rainfall events with a clear seasonal pattern. It also shows a decline in water levels from approximately 13 m below ground level (mBGL) in 1999 to approximately 26 mBGL in 2007. This confirms the strong influence of the drought on groundwater levels in the alluvial aquifers. Following the break of the drought (end of 2007), the groundwater level recovered within one to two years to pre-drought levels. The rapid response to rainfall events suggests that the alluvial aquifer is probably recharged by the Lockyer Creek.
- Groundwater levels of bore RN14320257 (screened in the Marburg Subgroup) respond only to major rainfall events, whereas there is virtually no change following smaller events. Interestingly, a decline in water levels can be observed in 2008 at a time when the hydrographs of other bores showed rising water levels. This may be induced by groundwater abstraction but needs further investigation.
- The groundwater level hydrograph of bore RN14500103 (screened in the Walloon Coal Measures) shows no response to minor rainfall events. However, similar to bore RN14320257 (Marburg Subgroup), it also shows a weak response to major rainfall events. Likewise, decreasing groundwater levels can be observed from 2000 to 2007 as a consequence of the drought, although the drop in water levels occurs on a much smaller magnitude than within the alluvial aquifer.
- The groundwater level hydrograph of bore RN42231224 (screened in the Main Range Volcanics) shows some response to small rainfall events; however, overall its response is also more similar to the hydrographs of the other bedrock units than to those of the alluvial aquifer, with changes dominantly in response to long-term climate variability rather than short-term rainfall events.
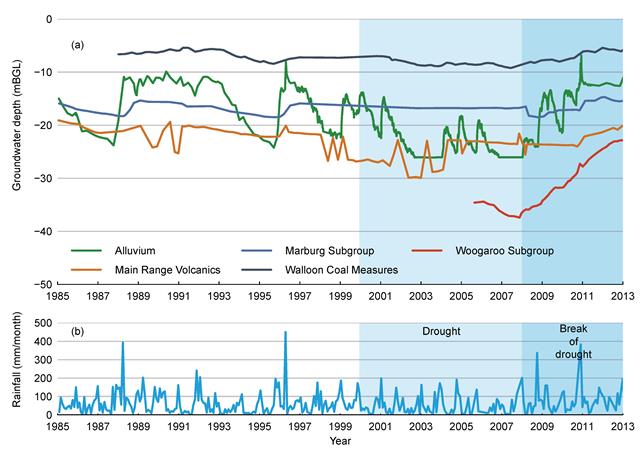
The selected bedrock bores are either in outcrops or close to outcrops and cannot represent the water level change in the deeper and confined part of bedrock aquifers.
Data: Bioregional Assessment Programme (Dataset 11)
Groundwater level elevation maps and groundwater flow direction
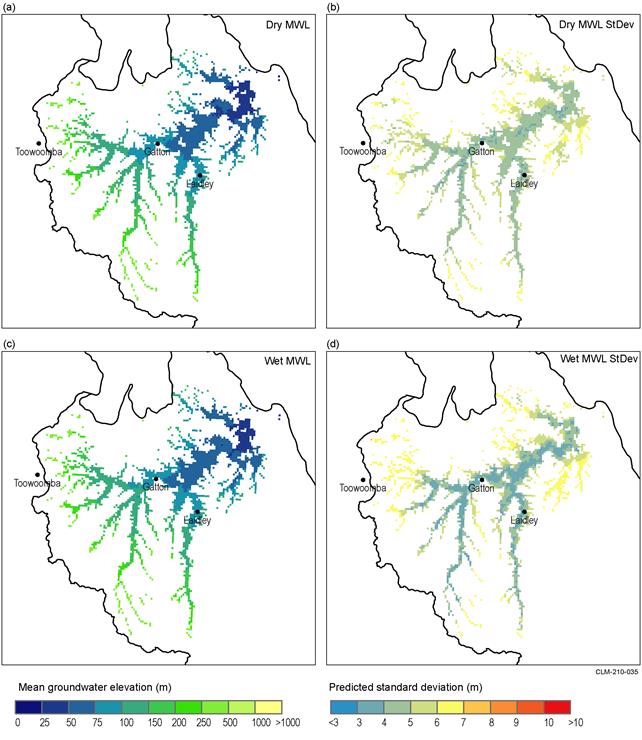
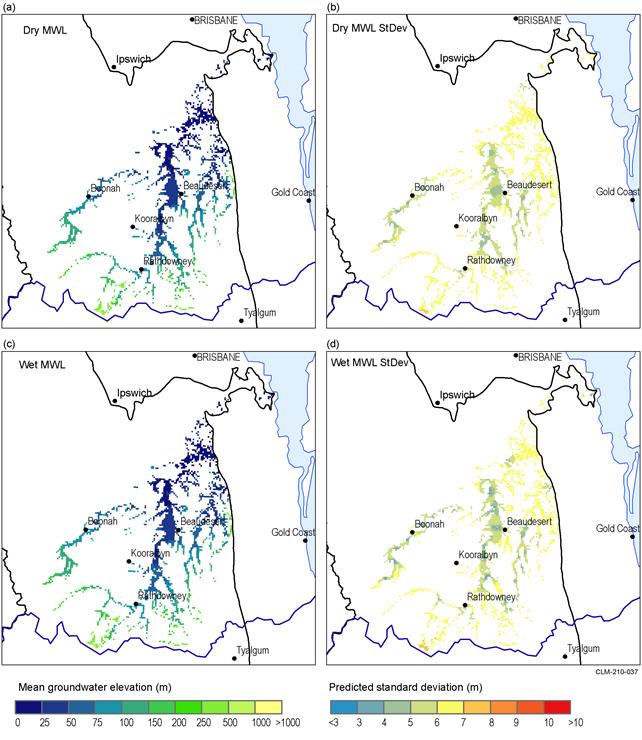
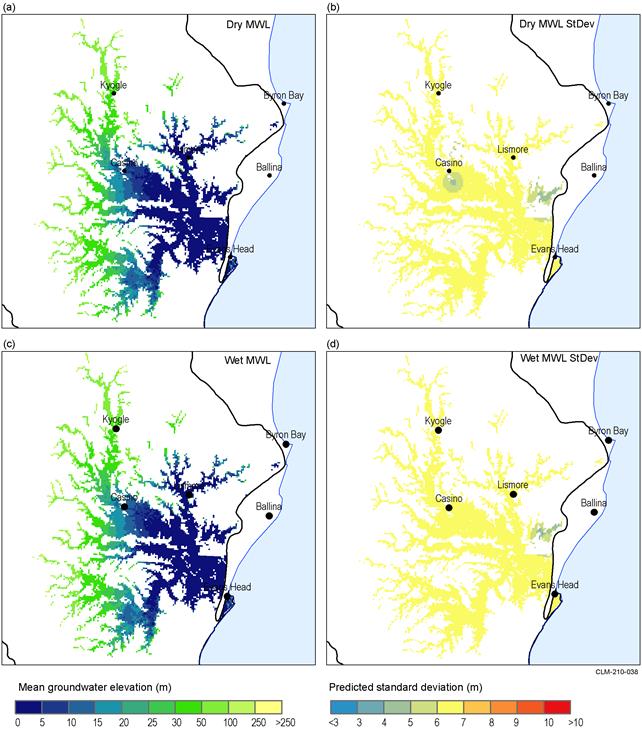
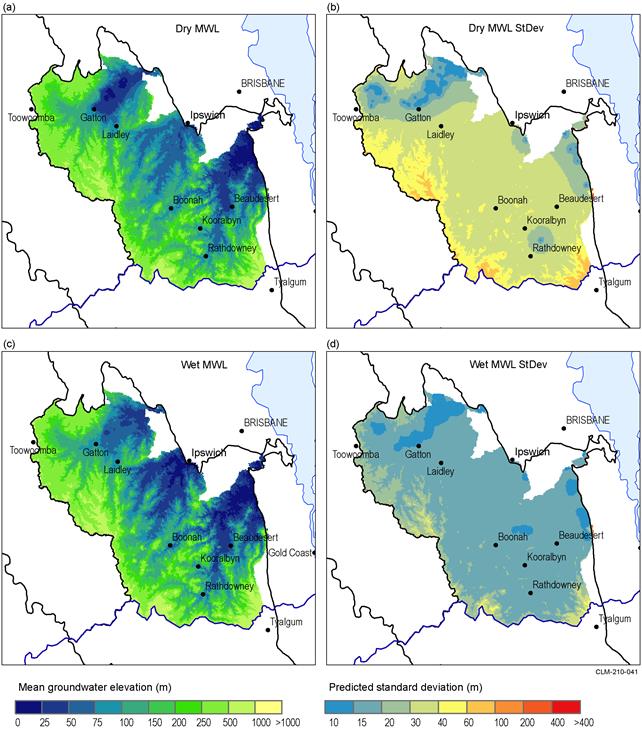
The contours of mean groundwater elevations for aquifers with sufficient groundwater data were generated using kriging interpolation (Figure 37 to Figure 43). Good spatial coverage of water level data enabled the analysis for the Walloon Coal Measures in the Bremer river basin (Figure 41). However, no analysis was conducted for the Walloon Coal Measures of the Richmond and Clarence river basins due to the paucity of data. Table 11 summarises the available water level records by aquifers, but does not indicate the spatial coverage of data. In addition, while Table 11 for example suggest that there are a large number of records for the Koukandowie Formation, 888 of the total 916 records for this formation are from only eight bores, which is not enough to generate contours.
Water levels generally follow the topographic gradient in alluvial aquifers. Groundwater flow direction is generally north-east following the topography in the Lockyer Valley, Bremer, and Logan-Albert river alluvia, and east in the Richmond River alluvium (Figure 22, Figure 37 to Figure 40). The spatial distribution of measurements is highly variable. Figure 22 indicates significantly higher data availability in the Lockyer Valley compared to the Richmond river basin. Hence, the uncertainty in the spatial interpolations is substantially higher in the Richmond river basin compared to the Lockyer Valley (Figure 37 and Figure 40).
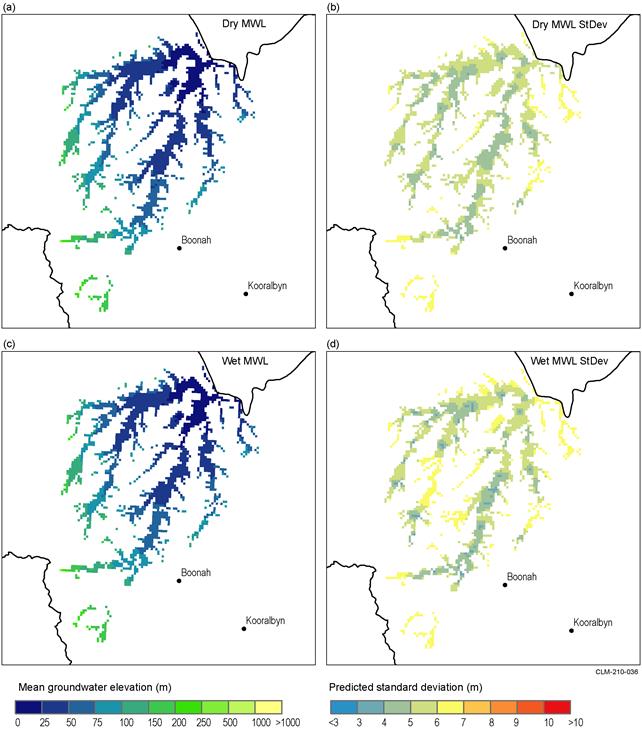
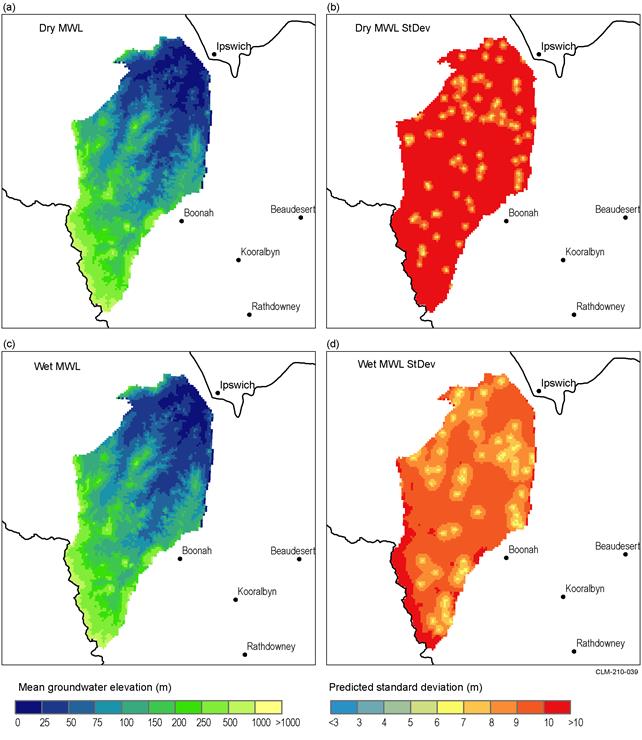
Groundwater flow also follows the topography in a north-easterly direction in bedrock aquifers such as the Walloon Coal Measures and the Gatton Sandstone (Figure 41 and Figure 42). In contrast, the groundwater flow direction in the Woogaroo Subgroup at the northern margin of the Clarence-Moreton Basin (in the Lockyer Valley) is in the opposite south-easterly direction towards the deep depositional centre located underneath the Bremer river basin (Figure 43). As this is where the Gatton Sandstone pinches out against the underlying Woogaroo Subgroup, it is very likely that discharge of groundwater from the Gatton Sandstone to the surface occurs here. This is supported by shallow watertables in the Gatton Sandstone and along the northern margin of the Lockyer Creek alluvial aquifer, as well as the presence of wetlands (see Section 2.1.5).
At the eastern margin of the Laidley sub-basin within the Bremer river basin (west of Ipswich), the general groundwater flow direction in the Walloon Coal Measures is towards the point where the Bremer River, Warrill Creek and Purga Creek exit the Clarence-Moreton Basin (Figure 41). In this area, which is bounded by the West Ipswich Fault the Clarence-Moreton Basin stratigraphic units pinch out against the low-permeability basement rocks at the margin of the sub-basin. As a result, groundwater from the Walloon Coal Measures and underlying formations is likely to be pushed upwards and discharged into the surrounding wetlands and alluvia (see Section 2.1.5). Similarly, in the Richmond and Clarence river basins, groundwater flow in the sedimentary bedrock is controlled by basement highs, which occur both in the north-east of the Richmond river basin and south-east of the Clarence river basin. The likely primary area of sedimentary bedrock groundwater discharge is located in the south-east of the Richmond river basin and north-east of the Clarence river basin in between these basement highs.
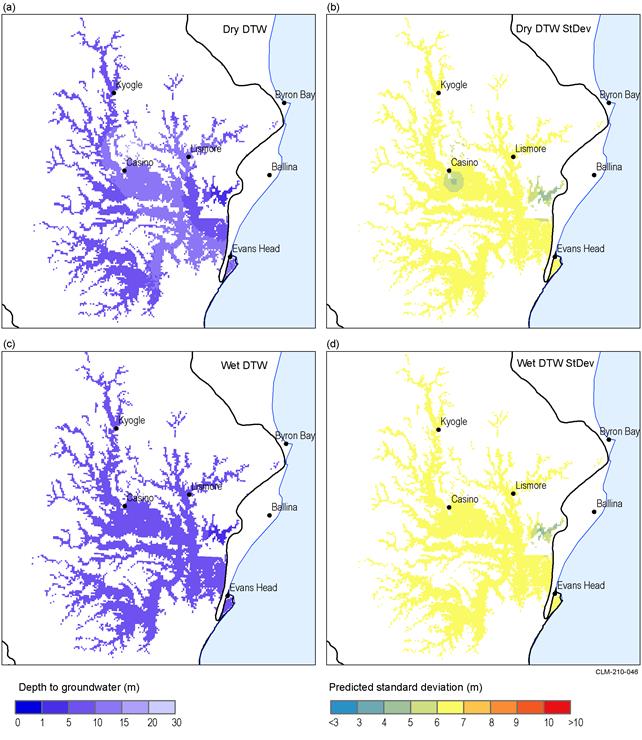
Uncertainty in groundwater level predictions is captured through a summary of prediction standard deviations. Generally, predictive uncertainty is relatively low close to bores (where data were collected) and increases with distance. In addition, in some locations, the predictive uncertainty increases as the topographic elevation increases. This arises because the topography is used as a predictor in the kriging, but wells tend to be located at lower elevations. Hence, there is greater uncertainty in predictions at higher elevations.
Data: Bioregional Assessment Programme (Dataset 12)
Data: Bioregional Assessment Programme (Dataset 12)
Data: Bioregional Assessment Programme (Dataset 12)
Data: Bioregional Assessment Programme (Dataset 12)
The analysis is limited to Walloon Coal Measures in the Bremer river basin where there are enough data.
Data: Bioregional Assessment Programme (Dataset 13)
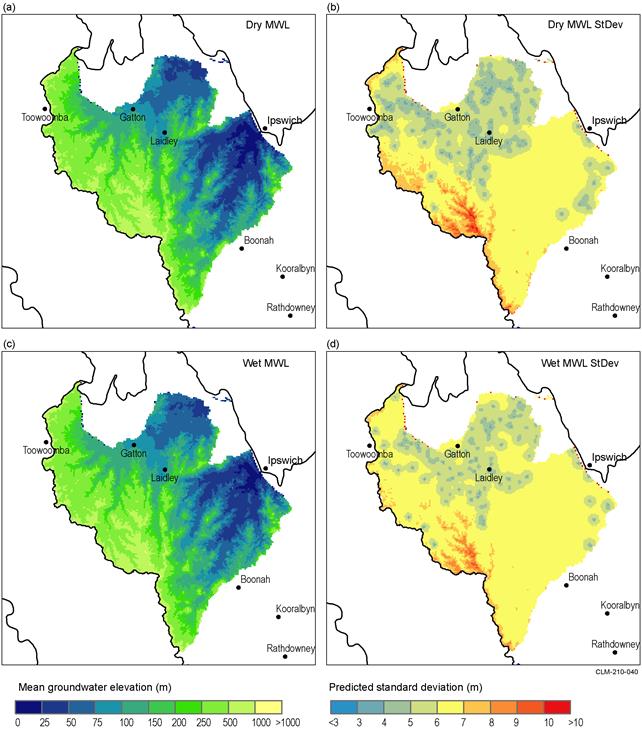
The analysis is limited to Gatton Sandstone in the Lockyer Valley and Bremer river basin where there are enough data.
Data: Bioregional Assessment Programme (Dataset 14)
The analysis is limited to Woogaroo Subgroup in the Lockyer Valley, and the Bremer and Logan-Albert river basins where there are enough data.
Data: Bioregional Assessment Programme (Dataset 15)
Mean depth to groundwater
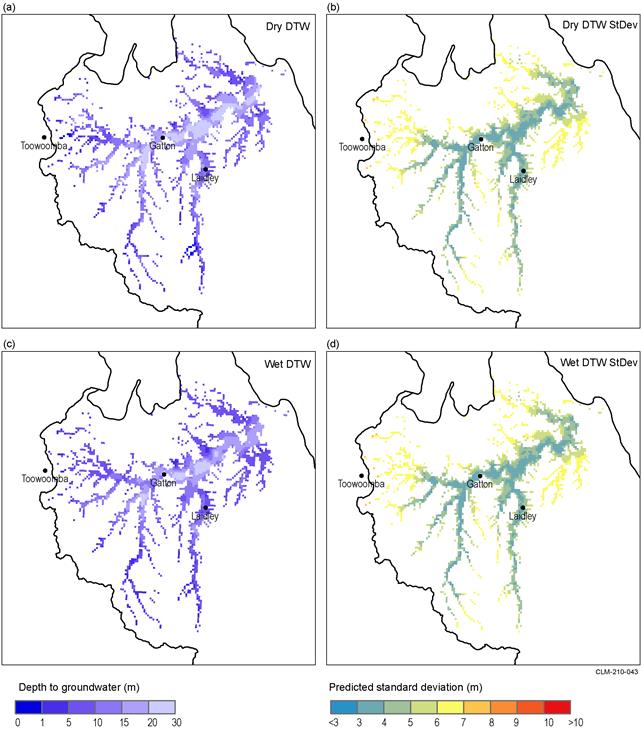
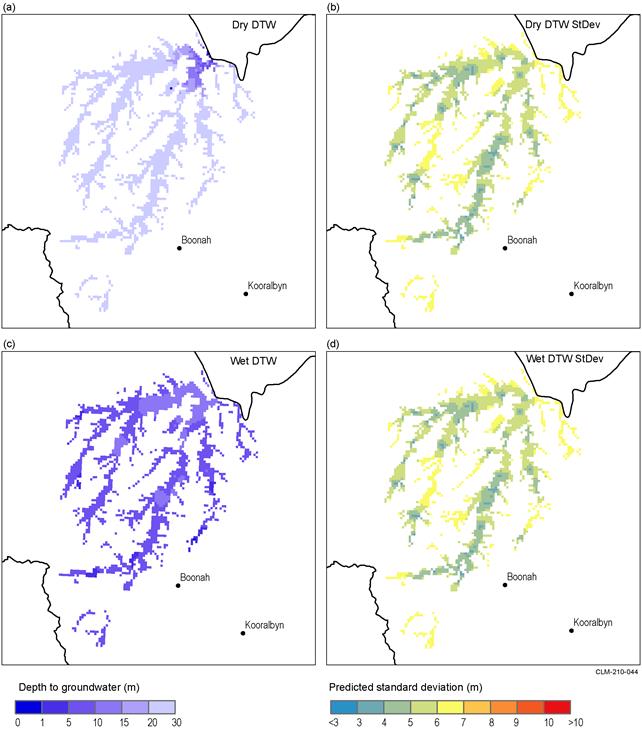
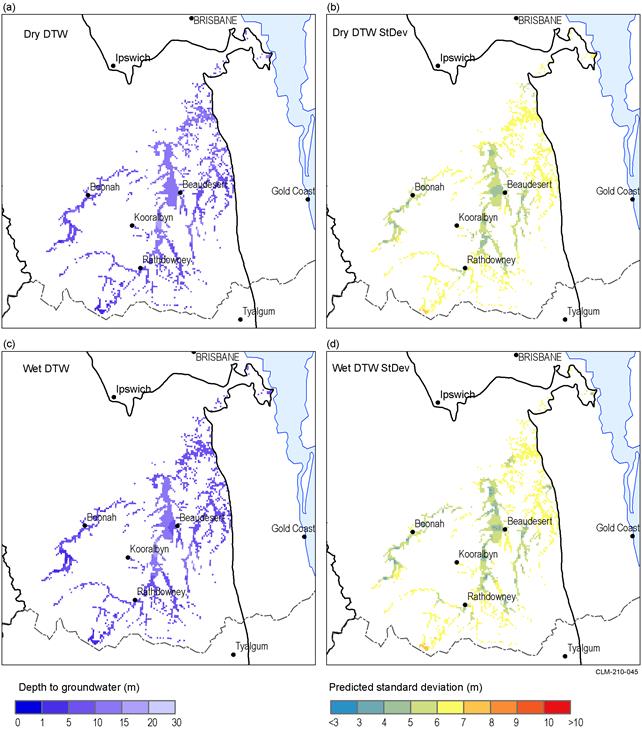
The mean depths to groundwater (watertable depth) for the alluvial aquifers are shown in Figure 44 to Figure 47 . The alluvial aquifers have a mean watertable depth in the range of 1.83 m to 17.54 m. A comparison of the watertable depths for the drought and periods following the break of drought shows that there is considerable difference in the watertable surfaces in some areas. This indicates a direct relationship to the recharge from rainfall and groundwater pumping.
The depth summary statistics (Table 14) indicate that the Lockyer Valley alluvium (‘Lockyer Valley alluvium (dry)’) has a mean depth to groundwater of 17.54 m during the dry period. This is the deepest of the alluvial systems within the Clarence-Moreton bioregion. Extensive groundwater extraction adds significant pressure on water levels – especially during drought periods. The decline of groundwater levels during the drought also induces upwards discharge from the underlying Gatton Sandstone into the alluvium. This is confirmed by a substantial increase in the electrical conductivity of groundwater in this area (see Section 2.1.3.4). Following the break of the drought, groundwater levels recovered to pre-drought levels, accompanied by a freshening of groundwater within the alluvial aquifers.
Groundwater depth is generally deeper in the central part of the alluvium, where the thickness of the alluvial sediments is greatest. At the edge of the alluvial aquifers, groundwater levels are typically shallower. This is associated with the generally smaller thickness of the alluvial aquifers at the basin margins, but also likely to be the result of groundwater discharge from the underlying bedrock into the alluvial aquifers at the margin of the alluvium. This is independently confirmed in the Lockyer Valley and Bremer Valley by water levels, water chemistry and electrical conductivities (Section 2.1.3.3.3) as well as isotopic data (Raiber, unpublished data).
Groundwater in the Woogaroo Subgroup is deeper than in other bedrock aquifers with a mean and a maximum depth of 38.43 and 92.46 m, respectively, based on the data that are mainly for the unconfined part of bedrock aquifers (Table 14). This might be related to the high quality of groundwater in the Woogaroo Subgroup in comparison to most other sedimentary bedrock units (the Woogaroo Subgroup contains very fresh groundwater with electrical conductivities which are often less than 300 µS/cm (see Section 2.1.3.3.3)). As a result, this aquifer is very heavily exploited for agriculture (primarily orchards in the Lockyer Valley), which may induce a substantial drawdown. In addition, the deep groundwater levels within the Woogaroo Subgroup might reflect that this formation dips very steeply towards the south-east at the northern basin margin.
Table 14 Statistical summary of the mean groundwater depth in main aquifers
Artesian bores are not included in this table.
Data: Bioregional Assessment Programme (Dataset 11, Dataset 16)
Data: Bioregional Assessment Programme (Dataset 12)
Data: Bioregional Assessment Programme (Dataset 12)
Data: Bioregional Assessment Programme (Dataset 12)
Data: Bioregional Assessment Programme (Dataset 12)
Temporal variability of groundwater levels
The statistical techniques provide a quantitative assessment of the temporal variability of groundwater levels as they respond to various stresses that are mainly driven by climate and/or extraction. The Mann-Kendall tau statistic (Mann, 1945) provides an indicator of the strength of the monotonic trend of a groundwater level time series. Values of –1 and 1 indicate a monotonic decline or rise in all groundwater heads in the series, respectively. Values between –1 and 1 correspond to less monotonic trends, with a zero value indicating an equal number of rises and declines among all data pairs in the time series. The Mann-Kendall tau statistic provided a means of identifying statistically significant trends in groundwater levels for a number of bores in the Lockyer, Bremer and Logan-Albert river alluvia as well as bedrock aquifers. Trends are deemed statistically significant when the p-value for the Mann-Kendall tau statistic is less than 0.05. The Theil-Sen estimator (also referred to as Sen’s slope estimate) (Theil, 1950; Sen, 1968) is a robust estimator of the rate of change of a monotonic groundwater trend (m/year). It provides insight into how rapidly the water level responds in different aquifers. For aquifers showing a statistically significant trend, box plots of the Sen’s slope estimate during the wet and dry periods were calculated (Figure 48 and Figure 49). The bores available for the analysis of the bedrock aquifers are mainly within/close to the area where bedrock aquifers outcrop. There are not enough data for the deep part of the bedrock aquifers to generate Sen’s slope values.
Substantial declines in water levels occurred during the drought in all alluvial aquifer systems within the Clarence-Moreton bioregion, followed by an increase in groundwater levels after the drought broke in 2007 to 2008. The magnitude of change is highly variable throughout different parts of the alluvial aquifer systems. For example, water levels in the Lockyer Valley aquifers had declined by more than 10 m in some areas (Figure 36), although part of this is possibly due to increased pumping. In many locations, following the break of the drought, the groundwater levels in alluvial aquifers have recovered to pre-drought levels, with maximum increases of groundwater levels greater than 20 m. However, in some areas, the magnitude of groundwater level change has been much smaller. In general, groundwater levels in the alluvium responded rapidly to variations in rainfall. The steepest declines were observed in the Bremer and Lockyer Valley alluvia at rates ranging from 1.36 to 3.75 m/year (Figure 48). More moderate declines were observed in the Logan-Albert and Richmond alluvia with the steepest being 1.32 and 0.13 m/year (Figure 48), respectively. Similarly, during the wetter period, the greatest rates of change were observed at bores of the Bremer and Lockyer Valley alluvia, with rates of 3.27 and 6.85 m/year (Figure 48), respectively. During these wetter years, the maximum observed rate of change for the Logan-Albert alluvium was 1.49 m/year. There were not enough data to obtain a statistically significant number for the Richmond alluvium (Figure 48). As expected, water levels were consistently declining during the drought period (2000 to 2007) with substantial recoveries in all systems after the drought period. This implies a good connection between the alluvium and the surface water.
Potentiometric surfaces in the bedrock aquifers also showed declining trends during the drought and a recovery following the break of the drought. The rate and the magnitude of the response during and after the drought, however, was less pronounced compared to the alluvial aquifers (Figure 49). Groundwater levels in bedrock aquifers generally follow long-term or decadal patterns and are less affected by short-term climate patterns. This is probably related to different recharge mechanisms (i.e. alluvial aquifers are closely linked to streams and receive recharge from streams, whereas bedrock aquifers are predominantly recharged by rainfall recharge within the Clarence-Moreton bioregion as indicated by the high electrical conductivities (EC)). In addition, this difference probably also reflects that the alluvial aquifers within the Clarence-Moreton bioregion are used more for extraction than the bedrock aquifers due to the often poor groundwater quality within bedrock aquifers. Pumping of alluvial groundwater during the drought due to diminishing surface water resources was a major driver of the declining groundwater levels within the alluvial systems. During the high-rainfall period, the steepest ascent in groundwater levels observed at a bore in the Gatton Sandstone was 4.01 m/year (Figure 49). Some bores in the Woogaroo Subgroup showed strong responses to climate variability, with the steepest decrease during the dry years occurring at a bore at a rate of –1.51 m/year and the steepest increase at one bore being 5.91 m/year. Changes in the Walloon Coal Measures were less pronounced, with the steepest decline during the dry period being –0.57 m/year and the steepest ascent during the wet period being 1.09 m/year (Figure 49).
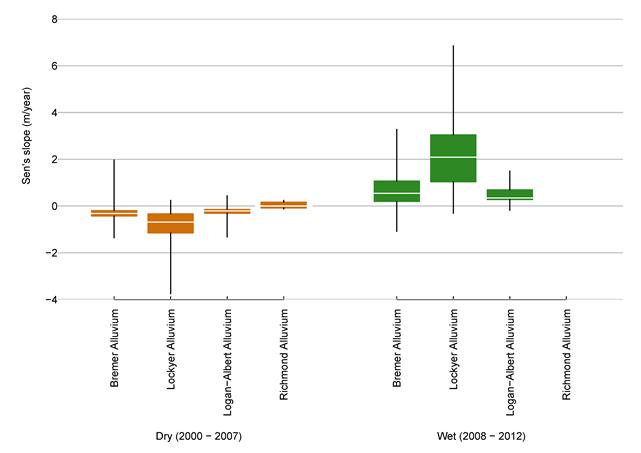
Black lines extend to the minimum and maximum values.
Data: Bioregional Assessment Programme (Dataset 11, Dataset 16)
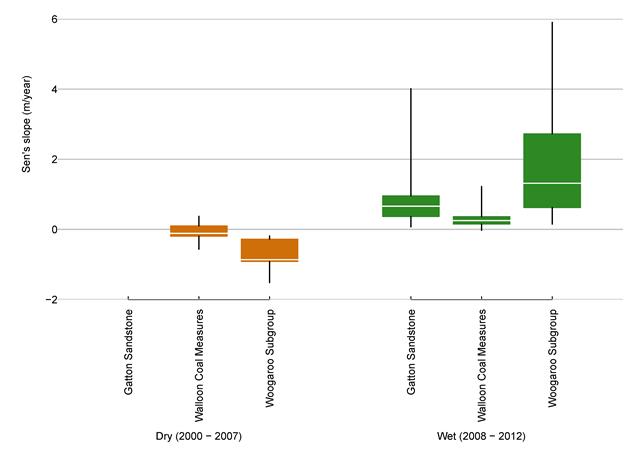
Black lines extend to the minimum and maximum values.
Data: Bioregional Assessment Programme (Dataset 11, Dataset 16)
