Spatial variability of groundwater chemistry
Groundwater chemistry can provide useful insights into a range of important groundwater processes, including:
- groundwater recharge
- hydrochemical evolution within aquifers (e.g. influence of ion exchange or methanogenesis)
- connectivity between different aquifers
- surface water – groundwater interactions.
This section describes the results of analyses of groundwater chemistry from the records in the Queensland and NSW groundwater databases. Multivariate statistical analyses of groundwater chemistry records (hierarchical cluster analysis; HCA) were conducted to make inferences about the likely processes that control spatial and temporal variability of water chemistry. These analyses are useful in identifying areas where deep aquifers (bedrock) might interact with shallow aquifers (alluvia) and where aquifers interact with streams. It will support the development of a conceptual model of causal pathways and a numerical groundwater model in the context of coal mining and potential CSG development.
For different river basins within the Clarence-Moreton bioregion, a hydrochemical assessment of different subsets of the groundwater chemistry dataset was conducted to account for region-specific characteristics. The analysis focused on areas with similar geology to avoid ‘dilution’ of the hydrochemical signal. For example, in the Bremer river basin, Walloon Coal Measures and Main Range Volcanics form the bedrock underneath much of the alluvium, whereas in the Lockyer Valley, the Walloon Coal Measures are almost absent. The different subsets of hydrochemistry for which a multivariate statistical analysis was conducted are as follows:
- bedrock (all bedrock samples from the entire Clarence-Moreton bioregion combined)
- Lockyer Valley (alluvium and bedrock)
- Bremer river basin, Warrill creek catchment, Logan-Albert river basin (alluvium and bedrock)
- Richmond and Clarence river basins (alluvium and bedrock).
The results of multivariate statistical analyses should not be considered in isolation, as it is possible to misinterpret them if the results are not placed within the geological and hydrogeological context. Therefore, it is important that these results are interpreted in combination with additional lines of evidence such as:
- a three-dimensional geological model or other geological information
- other types of hydrochemical information (e.g. isotopes or maps showing the distribution of EC)
- physical hydraulic measurements (e.g. potentiometric surface map, depth to groundwater maps)
- other region-specific datasets, such as wetlands, that may be an indication of surface water – groundwater interaction
- cross-sections that allow the inference of spatial relationships between aquifers and streams in selected areas.
Only major findings are presented for the results of the multivariate statistical analysis. The median concentrations of the identified hydrochemical clusters are also shown on Piper plots to compare the major differences between clusters. More detail will be provided as part of companion product 2.3 for the Clarence-Moreton bioregion (Raiber et al., 2016), where the hydrochemical patterns will be assessed for specific areas within the Clarence-Moreton bioregion to determine the degree of hydraulic connectivity between bedrock and shallow aquifers and between groundwater and surface water. Where sufficient data exist, this more detailed assessment will also include the differentiation of hydrochemical patterns during dry and wet periods.
Bedrock hydrochemical assessment
HCA of the bedrock water chemistry records in the Clarence-Moreton bioregion demonstrates that there is considerable hydrochemical variability, which is likely to be linked to the geological characteristics of the different bedrock formations. Following the identification and removal of outliers, seven distinct clusters were identified. The median values for the different parameters were calculated to identify the major characteristic of each cluster (Table 16). Cluster membership and source aquifer of the water chemistry sample (Figure 55) were compared to show how many water chemistry records from each stratigraphic unit were assigned to the different clusters. The spatial variability of the clusters is shown in Figure 54 .
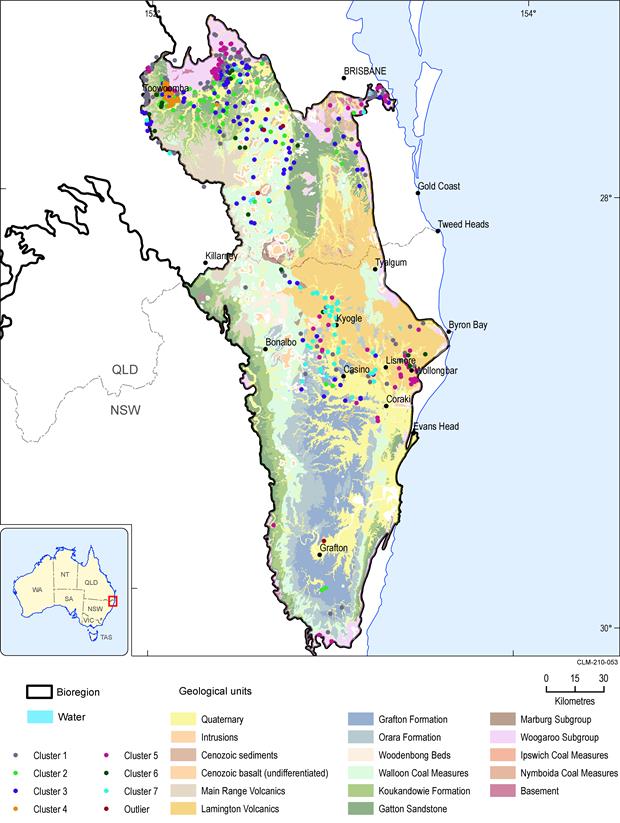
Data: Bioregional Assessment Programme (Dataset 17)
Hydrochemical characteristics of major bedrock stratigraphic units
Woogaroo Subgroup. The Woogaroo Subgroup is the oldest bedrock stratigraphic unit in the Clarence-Moreton Basin. Most groundwater samples collected from the Woogaroo Subgroup were assigned during the HCA to clusters 1, 4 and 5 (Figure 55, Table 15, Table 16).
Clusters 1 and 5 generally contain fresh groundwater with median EC of 820 µS/cm and 210 µS/cm, respectively, and a dominance of HCO3 over Cl (Figure 55). Cluster 4 contains samples that are brackish with a median EC of 3600 µS/cm. Overall, the Woogaroo Subgroup is the bedrock formation that contains the freshest groundwater in the Clarence-Moreton bioregion. This is likely attributed to the dominance of coarse-grained and clean quartz-rich sandstone as well as quartz-rich granule conglomerate over minor mudstones or siltstones (Rassam et al., 2014), and the lithological nature of this aquifer, which facilitates rapid groundwater recharge.
Some samples from the Woogaroo Subgroup, however, are assigned to cluster 2, which contains substantially more saline groundwater (median EC 12,000 µS/cm). The reasons are not clear, but could be explained in a few ways: (i) local differences in the composition of the Woogaroo Subgroup that impede groundwater recharge and movement, (ii) interactions with over- or underlying aquifer or (iii) the documented screened intervals of the bores were incorrectly assigned to the Woogaroo Subgroup.
Table 15 Median values for hydrochemical parameters of identified clusters in bedrock groundwater in the Clarence-Moreton bioregion
|
Cluster 1 |
Cluster 2 |
Cluster 2a |
Cluster 2b |
Cluster 3 |
Cluster 4 |
Cluster 5 |
Cluster 6 |
Cluster 7 |
|
|---|---|---|---|---|---|---|---|---|---|
|
Number of records |
209 |
115 |
86 |
29 |
166 |
73 |
105 |
39 |
55 |
|
Percentage of all records (%) |
27.4% |
15.1% |
11.3% |
3.8% |
21.8% |
9.6% |
13.8% |
5.1% |
7.2% |
|
Depth (mBGL) |
62 |
28 |
25 |
30 |
32 |
70 |
35 |
120 |
16.1 |
|
EC (µS/cm) |
820 |
12,000 |
9,580 |
19,500 |
4,250 |
3,600 |
210 |
1,700 |
970 |
|
pH (mg/L) |
7.7 |
7.8 |
7.8 |
7.8 |
8.1 |
7.7 |
6.4 |
8.4 |
7.45 |
|
SiO2 (mg/L) |
29 |
25 |
25 |
20 |
25 |
13 |
20 |
14 |
51 |
|
Na (mg/L) |
89 |
2,000 |
1,895 |
3,550 |
765 |
800 |
24 |
380 |
77 |
|
K (mg/L) |
5 |
16 |
14 |
27 |
5 |
30 |
2 |
3 |
1 |
|
Ca (mg/L) |
29 |
161 |
130 |
340 |
57 |
30 |
5 |
4 |
74 |
|
Mg (mg/L) |
19 |
239 |
200 |
505 |
76 |
15 |
4 |
2 |
43 |
|
HCO3 (mg/L) |
250 |
692 |
722 |
660 |
707 |
1,700 |
32 |
460 |
485 |
|
Cl (mg/L) |
100 |
3,918 |
3,000 |
7,030 |
997 |
295 |
28 |
222 |
87 |
|
NO3 (mg/L) |
0.5 |
5.0 |
4.0 |
12.5 |
2.5 |
2.0 |
0.5 |
0.5 |
0.7 |
|
SO4 (mg/L) |
7 |
199 |
186 |
334 |
31 |
10 |
3 |
6 |
14 |
Data: Bureau of Meteorology (Dataset 1), Bioregional Assessment Programme (Dataset 17)
Gatton Sandstone. The Gatton Sandstone is the second oldest bedrock stratigraphic unit of the Clarence-Moreton bioregion in this multivariate statistical analysis. Most hydrochemical records of the Gatton Sandstone are assigned to clusters 2, 3 and 4 (Figure 55, Table 16).
Groundwater assigned to cluster 2 is generally saline (median EC 12,000 µS/cm) with very low HCO3:Cl ratios (Figure 55), whereas groundwater grouped into clusters 3 and 4 is brackish and has higher HCO3:Cl ratios. Nearly 60% of all groundwater hydrochemical records in cluster 2 originate from the Gatton Sandstone, highlighting that the Gatton Sandstone appears to contain the most saline groundwater in the Clarence-Moreton bioregion. This distinct difference, when compared to the underlying Woogaroo Subgroup, also suggests that the hydraulic properties of the Gatton Sandstone are very different. While the Gatton Sandstone is also dominated by sandstones, these are likely to contain substantially more clay and cement (i.e. a matrix such as calcite, dolomite or silicate minerals that bind together the grains of the rocks) than the clean sandstones of the Woogaroo Subgroup (Rassam et al., 2014). As a result of this and also the commonly thick weathering profiles, groundwater recharge to the Gatton Sandstone is likely to be very slow and the potential for evapotranspiration to occur during or prior to groundwater recharge is high. All groundwater samples assigned to cluster 4 are sourced from the Gatton Sandstone and the Woogaroo Subgroup in the western part of the Lockyer Valley near Helidon. These groundwater sources have very high HCO3:Cl ratios (Figure 55) and elevated pH.
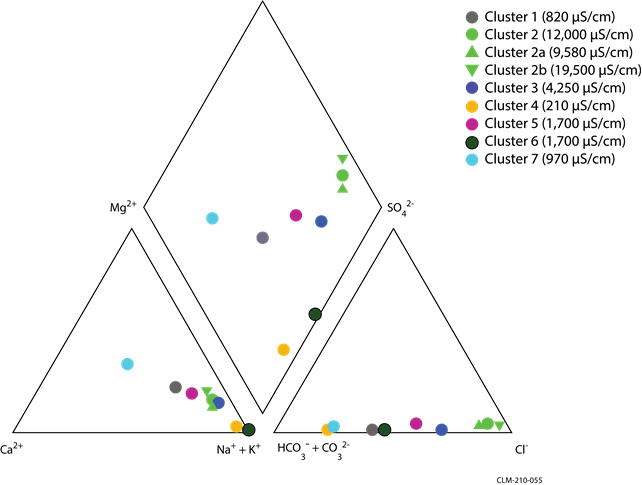
Table 16 Cluster membership of bedrock groundwater chemistry sampling records in the Clarence-Moreton bioregion
Data: Bureau of Meteorology (Dataset 1), Bioregional Assessment Programme (Dataset 17)
Koukandowie Formation. The hydrochemistry of groundwater collected from the Koukandowie Formation in the Clarence-Moreton bioregion shows similarities to the Gatton Sandstone, as indicated by the assignment of all samples to clusters 1, 2 and 3 and the dominance of brackish to saline groundwater. This indicates that the composition of the Koukandowie Formation is similar to the Gatton Sandstone, and hydraulic properties are likely similar.
Walloon Coal Measures. Most Walloon Coal Measures groundwater chemistry records contained within the Queensland and NSW groundwater databases for the Clarence-Moreton bioregion were collected from the Bremer river basin and the Logan-Albert river basin. Most of the outliers removed from the entire groundwater chemistry dataset prior to HCA are from the Walloon Coal Measures in the Bremer river basin (Figure 54). The characteristic properties that differentiate the outliers from other samples are their very high pH and very low HCO3 concentrations (pH is outside the range where HCO3 is the dominant carbonate species).
During the HCA, the hydrochemical records of the Walloon Coal Measures were mostly assigned to clusters 1, 2 and 3. A further subdivision of cluster 2 into clusters 2a and 2b ( Table 15 and Figure 55) shows that there are two distinct groups with a median of 9,580 µS/cm and 19,500 µS/cm, respectively. Most of the Walloon Coal Measures groundwater samples were assigned to the more saline cluster 2b. This is attributed to very low recharge rates and long retention times in the unsaturated zone prior to groundwater recharge, causing a high degree of evapotranspiration.
Walloon Coal Measures groundwater that has interacted with coal is assigned to cluster 6. These groundwater samples show the typical characteristics of CSG groundwater (Van Voast, 2003), such as elevated pH and very high Na and HCO3 concentrations, and simultaneously low Ca, Mg and SO4 concentrations as shown in the Piper diagram (Figure 55). This was independently confirmed by the analysis of dissolved methane (Raiber, unpublished data) which showed high concentrations for these groundwater samples. However, rather than being controlled exclusively by methanogenesis, some of these characteristics are also due to the influence of ion exchange: Ca and Mg are exchanged for Na. This is indicated by the large number of samples from the Main Range Volcanics and Lamington Volcanics contained in the same cluster (Table 16 and Figure 54). A further subdivision of this cluster would likely result in a separation of groundwater from the Walloon Coal Measure and the volcanic aquifers.
Bungawalbin Member (Orara Formation). Only four groundwater chemistry records assigned to the Bungawalbin Member were included in the HCA. These were assigned to clusters 3, 5 and 7 (Figure 55, Table 16), but due to the small number of samples, it is not possible to make any inferences about groundwater chemistry patterns within the Bungawalbin Member.
Piora Member (Grafton Formation). Groundwater chemistry samples from the Piora Member, which is only present in the NSW part of the Clarence-Moreton Basin, were assigned to clusters 1, 2, 5 and 7 (Figure 55, Table 16). Most of the samples assigned to these clusters contain comparatively fresh groundwater, and this freshness suggests that the Piora Member is likely to be a good aquifer (i.e. relatively high yields and relatively fresh groundwater) with comparatively high recharge rates. The similarity of groundwater of the Piora Member and groundwater sourced from the Lamington Volcanics suggests that the Piora Member is recharged through the overlying basalts.
Rapville Member (Grafton Formation). Similarly to the Piora Member, the Rapville Member is characterised by variable groundwater chemistry, as documented by the assignment of samples to clusters 1, 2, 3, 5 and 7 (Figure 55, Table 16). This might reflect a variable composition of this formation, but possibly also variable recharge processes. For example, the fresh groundwater of the Rapville Member assigned to cluster 5 might be related to recharge through the Lamington Volcanics, which overlie the formation in the north-eastern part of NSW, whereas the brackish groundwater might be related to recharge through outcrops of the formation. In contrast to the Piora Member, groundwater samples of the Rapville Member are also assigned to cluster 3, which contains more saline groundwater.
Main Range Volcanics and Lamington Volcanics. Most groundwater samples from the Main Range Volcanics are assigned to cluster 1, which contains samples that are characterised by their freshness (median 820 µS/cm) and high HCO3:Cl ratios (Figure 55). Interestingly, the Lamington Volcanics show more hydrochemical variability, as documented by assignment of most samples to clusters 1, 5 and 7. Cluster 7 samples are fresher than cluster 1 groundwater samples and have higher HCO3:Cl ratios (Figure 55). Furthermore, they were collected from bores that are shallower (median depth of 35 m below ground level) than the bores from which the cluster 1 samples originate (median depth of 62 m). This suggests that within the Lamington Volcanics, there appears to be a depth-related resolution that results in an increase of EC with depth. This indicates that there are shallow flow paths where groundwater is recharged rapidly and probably has only short residence times within the aquifers before it discharges at springs (discussed in more detail in companion product 2.3 for the Clarence-Moreton bioregion (Raiber et al., 2016)).
Lockyer Valley hydrochemical assessment
Seven clusters were identified during the HCA of groundwater chemistry in the Lockyer Valley. The main focus of this catchment-scale hydrochemical assessment was to identify areas where the alluvial aquifers interact with the bedrock or with surface water systems. While a very comprehensive evaluation of the spatial and temporal patterns is beyond the scope of the Assessment (but will be studied in more detail in subsequent parts of this Assessment), some key characteristics are:
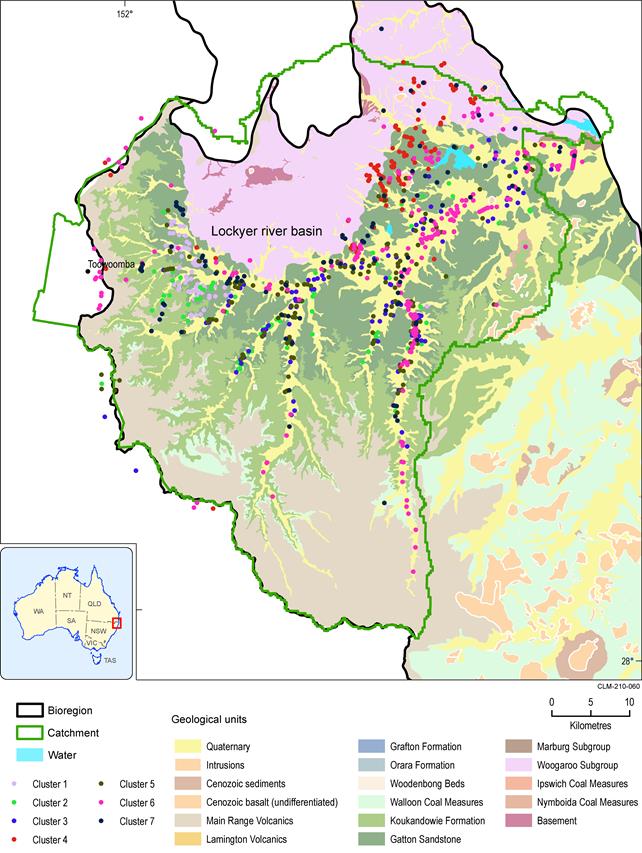
- Most alluvial groundwater chemistry records are assigned to clusters 2, 3, 5 and 6 (Figure 56). The median ECs of these clusters are highly variable, ranging from fresh (median of approximately 850 µS/cm in cluster 6 (Table 18)) to saline (median of approximately 9300 µS/cm in cluster 2 (Table 18)). This variability highlights the complex nature of groundwater recharge in this catchment.
- Many of the alluvial groundwater samples assigned to the most saline cluster (cluster 2) were collected from the alluvial systems of smaller tributary systems of the central Lockyer Creek drainage line. In their headwaters, most of these smaller tributaries are generally not deeply incised into the Main Range Volcanics of the Great Dividing Range. As a result, there is little or no influence of the basalts on the water chemistry, and instead it is influenced by discharge from the bedrock (Gatton Sandstone and Koukandowie Formation, which contain saline groundwater throughout most of the catchment) to the alluvium. In addition, saline alluvial groundwater samples of cluster 2 are also present at the edge of the alluvium throughout different parts of the catchment, confirming that the Gatton Sandstone and the Koukandowie Formation discharge into the alluvial aquifer at the edge of the alluvium.
- Alluvial groundwater samples assigned to cluster 6 (median EC of ~850 µS/cm (Table 18)) dominate the headwaters of the larger tributaries of the Lockyer Creek such as Laidley Creek (Figure 57), but are also present further downstream. Apart from their low salinities, groundwater samples within this cluster are characterised by relatively high Ca:Na and Mg:Na and HCO3:Cl ratios (Figure 56). These are typical hydrochemical characteristics of groundwater recharge by streams (Raiber et al., 2012), although basalt groundwater from the Main Range Volcanics can also share these attributes (Figure 56, Table 17). These tributary systems are deeply incised into the Main Range Volcanics in their headwaters, and the hydrochemical results confirm that there is a strong hydraulic connection of the alluvial aquifers with the basalts of the Main Range Volcanics. In addition, the presence of cluster 6 groundwater samples further down-gradient highlights a high degree of surface water – groundwater connectivity.
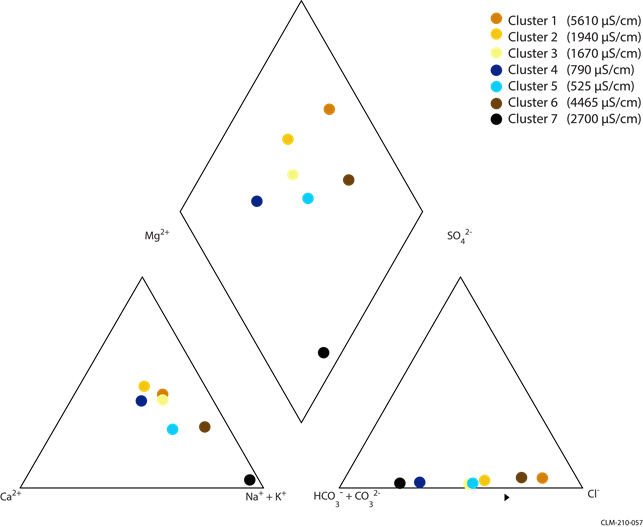
Table 17 Comparison of cluster membership and stratigraphic formation for hydrochemical assessment in the Lockyer Valley
Table 18 Median values for hydrochemical parameters of identified clusters in the Lockyer Valley
Data: Bioregional Assessment Programme (Dataset 18)
Data: Bioregional Assessment Programme (Dataset 18)
Bremer river basin, Warrill Creek catchment and Logan-Albert river basin hydrochemical assessment
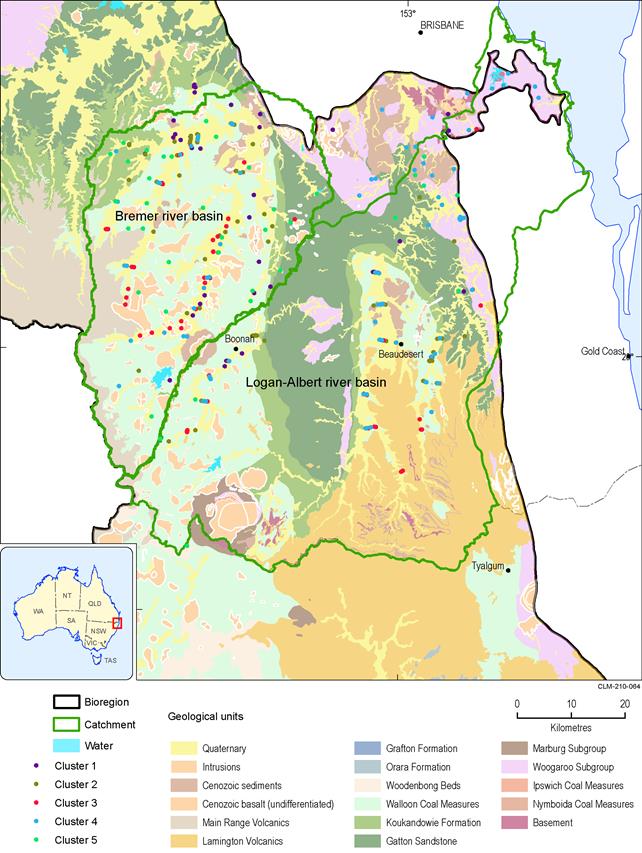
The Bremer river basin and Warrill creek catchment, as well as the Logan-Albert river basin, are dominated by the extensive outcrops of the Walloon Coal Measures and the presence of the basalts of the Great Dividing Range (Main Range Volcanics) and the Lamington Plateau (Lamington Volcanics) in the headwaters of the major rivers and creeks. Due to their geological similarities, the water chemistries of these river basins were assessed together.
Five distinct hydrochemical clusters were identified during the HCA. The major chemical characteristics of the alluvial groundwater in these river basins are:
Median groundwater EC of the clusters that were identified during the HCA in these catchments range from 860 µS/cm to approximately 6925 µS/cm (cluster 1, Table 19). Most alluvial groundwater samples were assigned to clusters 2 and 3 (Table 20).
- Groundwater assigned to cluster 3 (median EC of approximately 950 µS/cm) occurs primarily in the headwaters or close to the central drainage line of the major rivers and creeks (e.g. Bremer River, Warrill Creek and Logan-Albert River (Figure 59)). Cluster 3 is characterised by high HCO3:Cl ratios and high Ca:Na and Mg:Na ratios (Figure 58), all of which are characteristics of groundwater recharged by streams and through the basaltic aquifers. This groundwater is therefore likely to be related to direct or indirect (via surface water runoff) recharge from the basalts of the Main Range Volcanics and Lamington Volcanics, which are prominent in the headwaters of these river basins. Further downstream, the presence of cluster 3 near the central drainage lines in the Bremer river basin and Warrill creek catchment also indicates that surface water recharge to the alluvial aquifer occurs here.
- The more saline alluvial groundwater (cluster 1; Table 19) has very high Cl:HCO3 and very low Ca:Na and Mg:Na ratios (Figure 58), and was collected from bores further down-gradient. These bores are mostly located at the edge of the alluvium, and the water chemistry in these bores is more similar to the groundwater chemistry of the Walloon Coal Measures, which form the outcrop over much of the Bremer river basin and Warrill creek catchment and which typically contain relatively saline groundwater. The hydrochemical similarity within the alluvial aquifer and the underlying bedrock aquifer suggests that these aquifers are hydraulically connected.
- Where observation bore transects exist across floodplains, a typical pattern that can be observed is that of salinity increasing away from the creeks towards the edge of the alluvial aquifer. This transition is accompanied by a change from mostly cluster 3 near the central drainage lines towards the more saline clusters 1, 2 or 5.
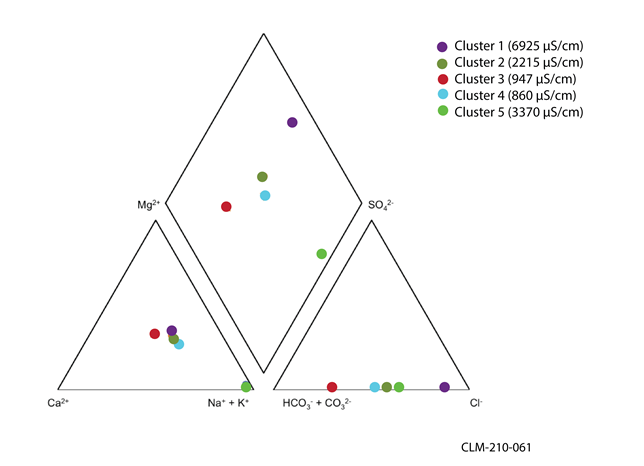
Table 19 Median values for hydrochemical parameters for different clusters in the Warrill creek catchment and Bremer and Logan-Albert river basins
Data: Bioregional Assessment Programme (Dataset 18)
Table 20 Comparison of groundwater cluster membership and stratigraphic formation for the Warrill creek catchment and Bremer and Logan-Albert river basins
Data: Bioregional Assessment Programme (Dataset 18)
Data: Bioregional Assessment Programme (Dataset 18)
Hydrochemical assessment of the Richmond and Clarence river basins
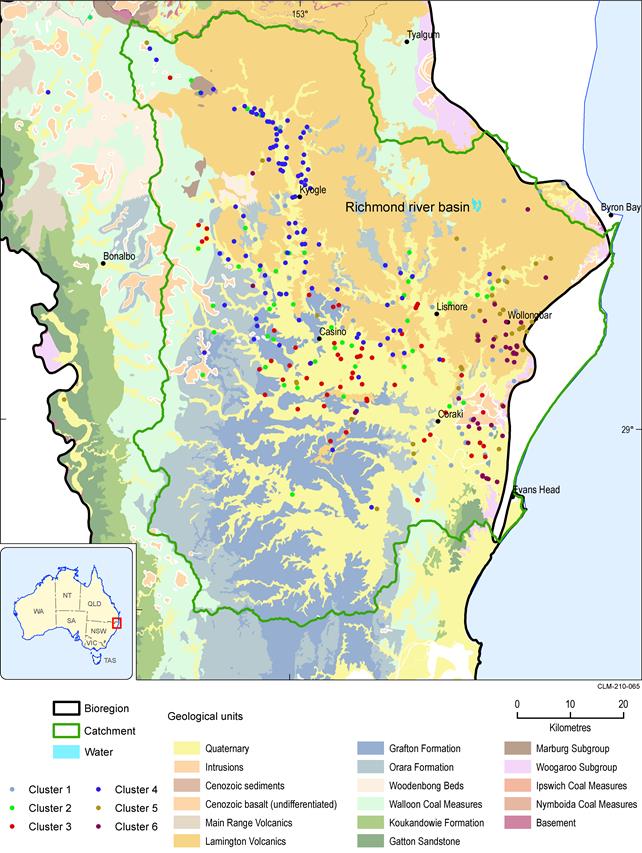
Six hydrochemical clusters were identified during the HCA of groundwater chemistry in the Richmond and Clarence river basins (most samples are sourced from the Richmond River; Table 21, Figure 60).
Major characteristics of the hydrochemistry in the Richmond and Clarence river basins are:
- Cluster 4 alluvial groundwater samples dominate the headwaters of the Richmond River alluvium in the western part of the Lamington Plateau near Kyogle (Figure 60). As noted before in the hydrochemical assessment of the bedrock stratigraphic units (Table 15, Figure 55, Table 16), two distinct groups with very fresh and fresh groundwater, respectively, have been identified within the Lamington Volcanics. Alluvial groundwater samples assigned to cluster 4 in the assessment of hydrochemical variability within the Richmond river basin have high HCO3:Cl ratios and high Ca:Na and Mg:Na ratios (Figure 61). These groundwater samples are likely to have evolved by discharge from the bedrock into the alluvium or surface water recharge.
- Clusters 2 and 3 contain the more saline groundwater in the Richmond and Clarence river basins. These sampling sites are primarily located on the floodplains of Richmond River, and indicate a lack of influence of the Lamington Volcanics, less influence of surface water recharge and more influence of rainfall recharge. The absence of hydrochemical signatures that indicate surface water recharge on the central part of the floodplain in the Richmond river basin contrasts with the hydrochemical observation from other river basins within the Clarence-Moreton bioregion. This may be linked to the different geomorphological and geological characteristics of the Richmond river basin, where the alluvial aquifer system is much wider and has a lower width-to-depth ratio than other alluvia within the Clarence-Moreton bioregion.
- Clusters 5 and 6 contain the freshest groundwater in the Richmond river basin. These groundwater samples were mostly collected from the eastern part of the Richmond river basin. This groundwater was likely recharged via discharge from the basalts or surface water recharge in the steep headwater catchments in this area. Unlike other fresh groundwater in the Clarence-Moreton bioregion, this groundwater has lower HCO3:Cl and lower Ca:Na and Mg:Na ratios (Figure 61).
Generally, it appears as if the groundwater in the Richmond river basin is fresher than in the river basins north of the state border between NSW and Queensland. There appears to be less interaction of the sedimentary bedrock units, which contain the most saline groundwater with shallow alluvial aquifers, namely the Gatton Sandstone, Koukandowie Formation and the Walloon Coal Measures south of the border, as the areas where these bedrock units underlie alluvial systems are much smaller than in south-east Queensland. Furthermore, the extent of the volcanic bedrock which is generally associated with high recharge rates and fresh groundwater in the Richmond river basin is larger than in the Lockyer Valley or Bremer river basin. This means that the influence of this volcanic bedrock aquifer on adjacent alluvial aquifers is larger in the Richmond river basin than elsewhere within the Clarence-Moreton bioregion (further discussed in companion product 2.3 for the Clarence-Moreton bioregion (Raiber et al., 2016)).
Data: Bioregional Assessment Programme (Dataset 19)
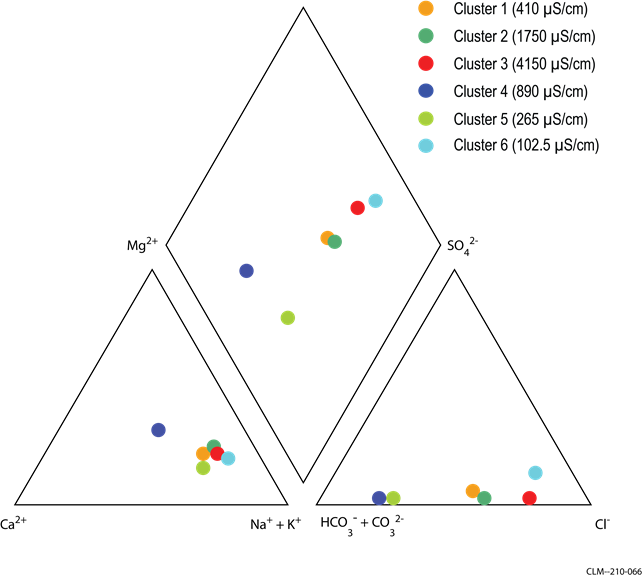
Table 21 Median values for hydrochemical parameters for different clusters in the Richmond and Clarence river basins
Data: Bioregional Assessment Programme (Dataset 19)
Table 22 Comparison of groundwater cluster membership and stratigraphic formation for the Richmond and Clarence river basins
Data: Bioregional Assessment Programme (Dataset 19)
Temporal variability of groundwater chemistry
While a comprehensive assessment of the temporal change of groundwater chemistry is outside the scope of this report, an assessment was conducted from sites where at least eight groundwater chemistry sampling events were conducted to assess whether cluster membership changes over time. As shown in Table 23, Table 24 and Table 25, there appears to be considerable variability, and for many of the sites, the cluster membership switches between at least two clusters. Many of these sites are located relatively close to creeks or rivers, suggesting that there may be a change of recharge mechanism, e.g. more surface-water dominated during periods of above average rainfall, and a stronger influence of rainfall recharge or discharge from the underlying bedrock at other times. The variability of surface water – groundwater connectivity is discussed in more detail in Section 2.1.5.
Table 23 Temporal variability of hierarchical cluster analysis membership in the Lockyer Valley for bores where time-series data are available (the numbers correspond to the number of hydrochemical records assigned to a cluster)
Data: Bioregional Assessment Programme (Dataset 18)
Table 24 Temporal variability of hierarchical cluster analysis membership in the Richmond river basin for bores where time-series data are available (the numbers correspond to the number of hydrochemical records assigned to a cluster)
Data: Bioregional Assessment Programme (Dataset 19)
Table 25 Temporal variability of hierarchical cluster analysis membership in the Warrill creek catchment and Bremer and Logan-Albert river basins for bores where time series data are available (the numbers correspond to the number of hydrochemical records assigned to a cluster)
Data: Bioregional Assessment Programme (Dataset 2, Dataset 18)
