Transmissivity and hydraulic conductivity determine the capability and efficiency of an aquifer to transmit groundwater. In the context of coal mining and CSG extraction, these parameters serve as controlling factors to the impact of coal resource developments on their surrounding aquifers. They also have a dominant role in spreading potential contaminants. This analysis aims to gain a comprehensive understanding of the hydraulic properties of main aquifers in the Clarence-Moreton bioregion, provide initial hydraulic parameters for the subsequent numerical groundwater model, and locate gaps in the state groundwater databases.
Analyses of the hydraulic parameters were conducted for the alluvium and several bedrock aquifers where enough data were available. The log-transformed hydraulic conductivities generally follow a normal distribution (Figure 50) and there is no clear relationship between hydraulic conductivity and screen depth in the alluvium (Figure 51). The box plots in Figure 52 and Figure 53 demonstrate the variability of transmissivity and hydraulic conductivity across aquifers. Transmissivity and hydraulic conductivity in the Lockyer Valley, Bremer and Logan-Albert river alluvia are similar in terms of median values, although they can change over a range of six orders of magnitude. The Richmond River alluvium shows a lower hydraulic conductivity than any other alluvium. Transmissivity is more uniform than hydraulic conductivity in the alluvium. The bedrock aquifers are less permeable than the alluvium with variations between one to two orders of magnitude. Most of the current data for the bedrock aquifers relate to the area where outcrops appear. The confined part of the bedrock aquifer should show lower hydraulic properties. The limited data suggest that the Woogaroo Subgroup is the most permeable aquifer among the bedrock aquifers. Most pumping tests for the Lamington Volcanics were conducted in the area surrounding Kyogle and Lismore. The fractured basalt has a median hydraulic conductivity of 3.82 m/day, which is similar to the unconfined bedrock aquifers.
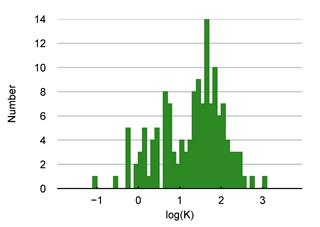
Data: Bioregional Assessment Programme (Dataset 7, Dataset 8)
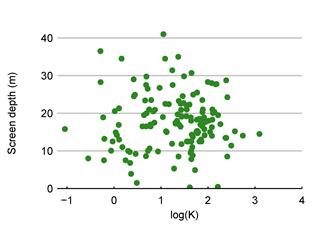
The screen depth was considered to be the midpoint of the screen interval.
Data: Bioregional Assessment Programme (Dataset 7, Dataset 8)
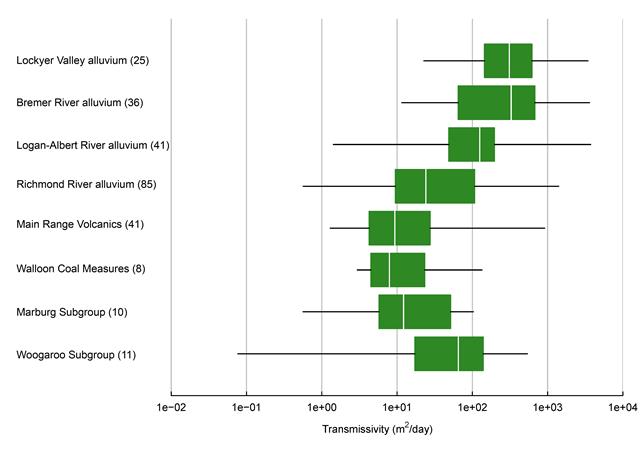
Figure 52 Box plot to show the transmissivity range of aquifers with enough data
The black lines in the plot extend to the minimum and maximum for each aquifer. The extent of the green boxes represents the 25th (left) and 75th (right) percentile, respectively. The white line represents the median. The number of records for each unit downward is shown in brackets after the formation name.
Data: Bioregional Assessment Programme (Dataset 7, Dataset 8)
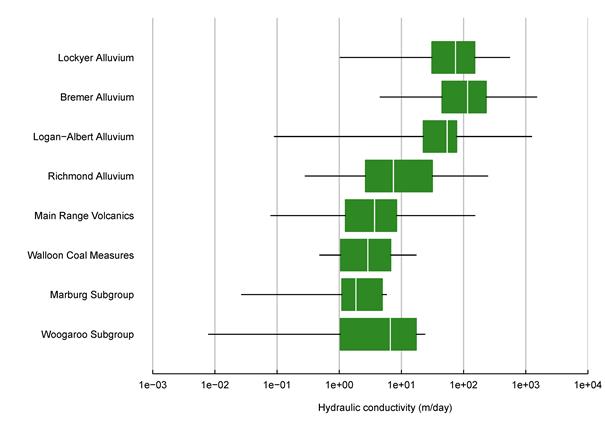
Figure 53 Box plot to show the hydraulic conductivity range of aquifers with enough data
The black lines in the plot extend to the minimum and maximum for each aquifer. The number of records for each unit downward is 30, 25, 40, 75, 39, 8, 9, and 11, respectively.
Data: Bioregional Assessment Programme (Dataset 7, Dataset 8)
