2.6.2.7.2.1 Analytic element model
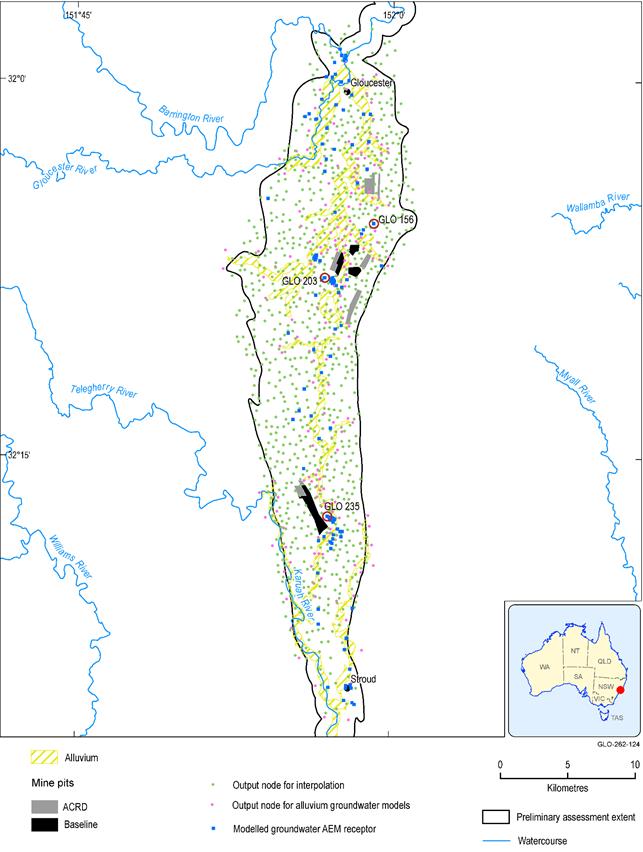
As stated in Section 2.6.2.1 and Section 2.6.2.3, the regional GW AEM is designed to probabilistically estimate the hydrological change due to coal resource development on the groundwater bores screened in the surface weathered and fractured rock layer (Figure 2, Figure 19).
Figure 19 Regional analytic element groundwater model output locations
ACRD = additional coal resource development, AEM = analytic element model
Data: Bioregional Assessment Programme (Dataset 2, Dataset 3, Dataset 4)
The GW AEM also provides the time series of change in the lower boundary condition for the Avon and Karuah alluvial MODFLOW models. As drawdowns vary smoothly in space and time and to avoid the numerical burden of computing drawdown time series at every 90 m grid cell with a monthly time step, outputs were generated only for the surface weathered and fractured rock layer at a selection of 108 points (Figure 19) every ten years of simulation between 0 and 100 years. This selection of output locations and times is the result of a trial-and-error procedure to ensure information loss is minimal. The spatial density of points was controlled by the position of the Avon River and Karuah River alluvium model grid and the proposed coal seam gas (CSG) development area. For communication with the alluvial groundwater models, this model output was resampled and interpolated to the desired spatial and temporal resolution.
To produce the probabilistic maps of the maximum difference in drawdown (dmax) under the baseline coal resource development (baseline), under the coal resource development pathway (CRDP) and due to the additional coal resource development (obtained as the difference in drawdown between CRDP and baseline), an interpolation is carried out on the model results evaluated at the 1000 locations shown in Figure 19. To rationalise the computational resource requirements, the evaluation of the analytic element model at the 1000 locations is only done with a sample of 200 parameter combinations from the final posterior parameter distributions.
For each bore included in the receptor list, the groundwater model produces a time series of drawdown under the historical and baseline conditions and a time series of drawdown under the historical and CRDP conditions. The effect of implementing the CRDP is the difference between these two time series. Two measures are used to summarise this time series: dmax and tmax. The maximum difference in drawdown in the simulation period is dmax – that is, the maximum difference between the CRDP drawdown and baseline drawdown, due to the additional coal resource development. Therefore, dmax can be either positive or negative. The year when this maximum change occurs is tmax.
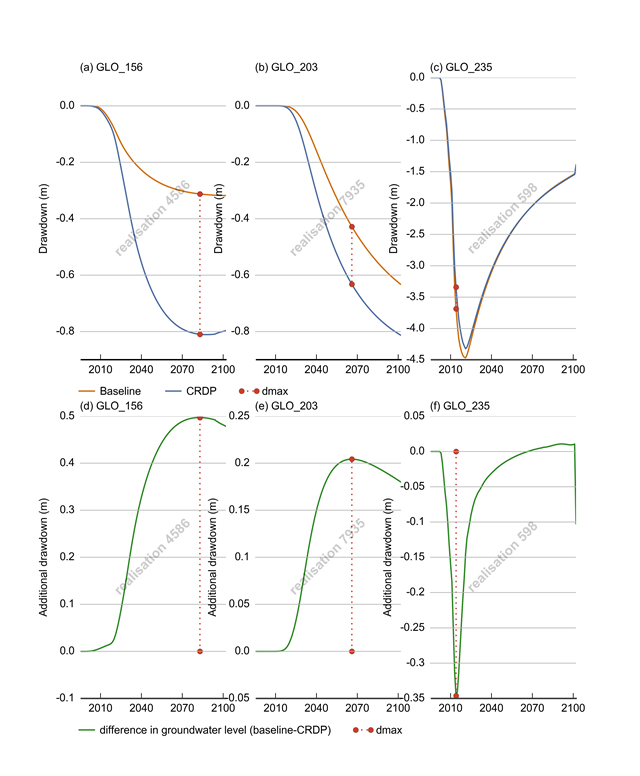
This is illustrated in Figure 20, for receptors GLO_156, GLO_203 and GLO_235. The location of these receptors is indicated in Figure 19. GLO_156 is situated between the Rocky Hill Coal Project and Stratford Mining Complex developments, about 2 km from both. GLO_203 is within 500 m of the western boundary of the Stratford Mining Complex and GLO_235 is less than 500 m from the Duralie Coal Mine. Figure 20 shows the simulated drawdown at these locations for both baseline and CRDP for the realisation that is closest to the median predicted impact (see Section 2.6.2.1). The bottom set of plots in Figure 20 shows the difference between the baseline and CRDP runs and illustrates the computation of dmax and tmax.
For receptor GLO_156, the maximum drawdown under the CRDP is realised within the simulation period. The timing of the maximum difference in drawdown (dmax) coincides with the maximum drawdown under the CRDP. At receptor GLO_203, the maximum drawdown under both baseline and CRDP is not achieved before the end of the simulation period. The maximum difference in drawdown (dmax), however, occurs around 2060. This indicates that in that period, the drawdown during CRDP is simulated to happen at a faster rate than in the baseline.
Receptor GLO_235 shows a negative drawdown due to additional coal resource development (additional drawdown), that is, less drawdown under CRDP than for under the baseline. In this particular case this is due to the fact that the increase in pumping rate from Duralie Coal Mine under the CRDP is not proportional to its increase in area. This causes the centre of the cone of depression under the CRDP to move north, locally resulting in less drawdown. Towards the end of the simulation period, the increased pumping rate does manifest itself as an increased drawdown (Figure 20(f)).
Additional drawdown is the maximum difference in drawdown (dmax) between the coal resource development pathway (CRDP) and baseline, due to the additional coal resource development (ACRD).
Data: Bioregional Assessment Programme (Dataset 2)
2.6.2.7.2.2 Alluvial MODFLOW models
As outlined in Section 2.6.2.1, the alluvial MODFLOW models are designed to predict the drawdown due to additional coal resource development and year of maximum change at those receptors located within the alluvial model domain (Figure 10).
The alluvial MODFLOW models also provide time series of change in drainage flux. This change in flux is combined with the Australian Water Resources Assessment landscape model (AWRA-L) streamflow predictions to simulate the change in total streamflow (see companion product 2.6.1 for the Gloucester subregion (Zhang et al., 2018)). The MODFLOW drainage flux is aggregated for each monthly stress period for each of the catchments defined in AWRA-L, the area upstream of each surface water receptor (Figure 10).
The components of the water balance are not specified as a hydrological response variable of relevance for a receptor impact model and are therefore not reported in this product. Companion product 2.5 for the Gloucester subregion (Herron et al., 2018) does summarise the water balance for the alluvial MODFLOW models and the change in these balances for selected periods in the future.

Product Finalisation date
- 2.6.2.1 Methods
- 2.6.2.2 Review of existing models
- 2.6.2.3 Model development
- 2.6.2.4 Boundary and initial conditions
- 2.6.2.5 Implementation of coal resource development pathway
- 2.6.2.6 Parameterisation
- 2.6.2.7 Observations and predictions
- 2.6.2.8 Uncertainty analysis
- 2.6.2.9 Limitations and conclusions
- Citation
- Acknowledgements
- Currency of scientific results
- Contributors to the Technical Programme
- About this technical product


