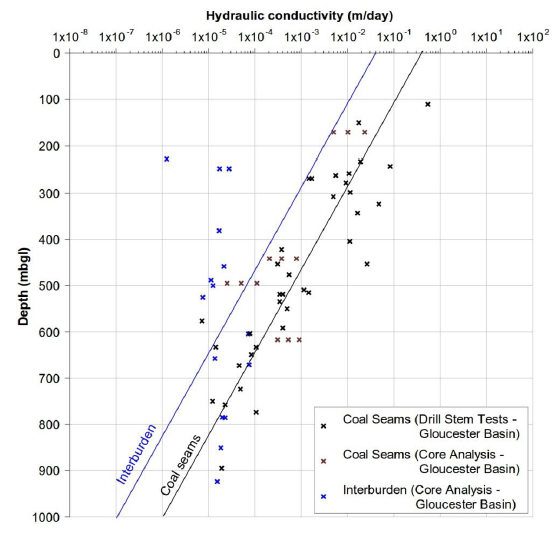
Table 5 lists the parameters of the regional analytic element groundwater model (GW AEM) included in the sensitivity and uncertainty analysis together with a short description, a starting value and the range within which the parameter is expected to vary. The parameters are organised in three groups. The ‘stochastic’ group parameters are integer values that refer to a stochastic realisation of the coal seams, major or subseismic faults. The 1000 realisations of the number and position of the coal seams, major fault probability and subseismic fault distribution are randomly combined with the other parameters. The ‘hydraulic properties: sedimentary rocks’ group consists of all parameters that control the hydraulic properties, such as hydraulic conductivity and storage for the interburden and the coal seams. The ‘hydraulic properties: faults’ group has the parameters that govern the hydraulic behaviour of the faults in the model. The permeability of the coal seams in the Gloucester subregion has been observed to decrease with depth (Figure 16; Parsons Brinckerhoff, 2015).
Table 5 Parameters for the regional analytic element groundwater model for the Gloucester subregion
The ‘value’ column is an initial value, while the ‘minimum’ and ‘maximum’ columns span the range sampled in the design of experiment. na = not applicable; eq = equation; Kv = vertical hydraulic conductivity; Kh = horizontal hydraulic conductivity
Data: Bioregional Assessment Programme (Dataset 1)
Source: Parsons Brinckerhoff (2015), Figure 7.2, p. 41
It is assumed that the processes driving this decrease in permeability in the coal seams also affect the interburden, and hydraulic parameters that are a function of permeability, such as horizontal and vertical hydraulic conductivity, also decrease with depth. In a strict sense, the storage of a hydrostratigraphic unit is a function of the compressibility of the lithology and not of the permeability. However, in the GW AEM storage is also considered to decrease with depth, under the assumption that compressibility also decreases with depth.
The variation with depth of the hydraulic parameters is described with an exponential function of the form:
|
|
(6) |
with P the hydraulic parameter, a1 and a2 coefficients that control the exponential decrease, and d the depth in metres below the surface. Four such relationships are defined; the hydraulic conductivity (K) and storage (S) for the coal seams (CS) and for the interburden (IB). The ![]() parameter is the intercept (intercept) of the relation with the x-axis (i.e. the value of the parameter at zero metres depth). The
parameter is the intercept (intercept) of the relation with the x-axis (i.e. the value of the parameter at zero metres depth). The ![]() coefficient is the slope of the decrease of the parameter with depth. Larger values indicate a stronger decrease with depth of the parameter. In the Stratford Mining Complex groundwater model (Heritage Computing, 2012), similar equations are used for the initial values of hydraulic conductivity in the coal seams and the interburden:
coefficient is the slope of the decrease of the parameter with depth. Larger values indicate a stronger decrease with depth of the parameter. In the Stratford Mining Complex groundwater model (Heritage Computing, 2012), similar equations are used for the initial values of hydraulic conductivity in the coal seams and the interburden:
|
|
(7) |
|
|
(8) |
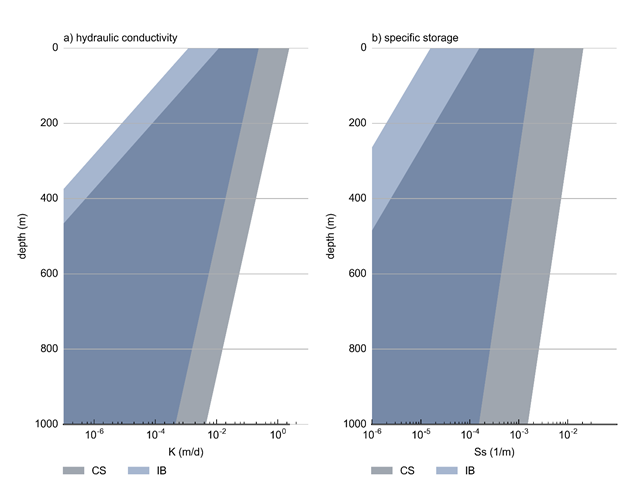
The ranges for the coefficients for hydraulic conductivity and storage for the interburden and for the coal seams used in the design of experiment are listed in Table 5. The range of hydraulic conductivity and storage those values correspond to are shown as a function of depth in Figure 17. Details on how this range is sampled is provided in Section 2.6.2.7.3 for the design of experiment and Section 2.6.2.8 for the uncertainty analysis.
Note the dark blue color is the result of the overlapping range for coal seam and interburden
Data: Bioregional Assessment Programme (Dataset 1)
The hydraulic properties are calculated for the centre of each layer, interburden or coal seam. Any hydraulic conductivities below 1 x 10⁻⁷ m/day or storage values below 1 x 10⁻⁶ are replaced with 1 x 10⁻⁷ m/day and 1 x 10⁻⁶ respectively. These thresholds ensure numerical stability and avoid physically unrealistic parameter values.
K_CS_intercept is the hydraulic conductivity of the coal seams at zero metres depth, which in the GW AEM corresponds to the surface weathered and fractured rock layer, and varies between 0.03 and 3 m/day. This range encompasses the values of hydraulic conductivity for the coal seams and fractured rock reported in companion product 2.1-2.2 for the Gloucester subregion (Frery et al., 2018) and the review of existing models (see Section 2.6.2.2). For K_IB_intercept, the hydraulic conductivity of the interburden at zero metres depth, the range of K_CS_intercept is lowered by an order of magnitude and varies between 3 x 10⁻³ to 0.3 m/day. This is in accordance with the values reported for the deep water-bearing layers in Table 8 in Section 2.1.3.1.2 of companion product 2.1-2.2 (Frery et al., 2018).
The only available information to infer the slope of the exponential decrease function is the dataset of permeability measurements of coal seams (Figure 16). The range chosen in the design of experiment for the interburden and coal seams is the same and varies from 6.5 x 10⁻³ to 2.6 x 10⁻² m-1. This range, in combination with the intercept values, ensures that hydraulic conductivity in both the coal seams and the interburden in the depth interval targeted for CSG extraction (between 200 m and 1000 m) ranges over at least four orders of magnitude. This very wide range is a reflection of the uncertainty associated with these properties.
Measured values of storage are not available to inform the ranges for the design of experiment. The intercept and slope values for coal seams and interburden are chosen such that the range spans at least two orders of magnitude, that interburden storage is less than the storage in the coal seams and that the 200 m to 1000 m depth range encompasses 1 x 10⁻⁵ m-1, the value most commonly assigned to storage at depth in the existing groundwater models in the region (see Section 2.6.2.2).
The interburden layers are simulated as leaky layers for which head and flux are not computed. These layers are represented through a vertical flow resistance term, c [T], which is computed as:
|
|
(9) |
with τ the thickness of the layer, Kh(dmid) the hydraulic conductivity evaluated at a depth corresponding to the middle of the layer, and KvKh the ratio between vertical and horizontal hydraulic conductivity. The range of KvKh is chosen to vary between 0.01 and 1, which means vertical hydraulic conductivity ranges from being equal to horizontal conductivity to being two orders of magnitude lower than horizontal conductivity. There are no direct measurements of vertical conductivity available to validate or constrain this range. The range represents the uncertainty in the conceptual understanding of the hydraulic properties in this region, from strongly anisotropic to isotropic. Due to predominantly horizontal sedimentological features in most sedimentary basins, it is considered very unlikely for vertical hydraulic conductivity to be greater than horizontal hydraulic conductivity.
The specific yield of the weathered zone leaky layer on top of the model is chosen to vary from 0.001 to 0.3, which represents a specific yield corresponding to a very low effective porosity (such as in a system where porosity only comprises the voids created by fractures) at the low end and a specific yield corresponding to a high porosity (such as in very coarse, unconsolidated material) at the high end.
The hydraulic properties of the faults are controlled by fhres, the resistance flow encounters entering the fault (flow normal to the fault plane) and fvres, the flow resistance within the fault (vertical flow along the fault plane). The flow entry resistance is computed as:
|
|
(10) |
with fw the width of the fault (m) and Kfh the horizontal hydraulic conductivity of the fault (m/day). The flow entry resistance is chosen to be equal for both major and subseismic faults and a nominal fault width of 1 m is adopted in this study. The range of the horizontal fault conductivity is chosen to vary from 1 x 10⁻⁵ m/day to 0.1 m/day. This range reflects the current uncertainty in the conceptual understanding of the hydraulic behaviour of faults as it allows the fault hydraulic behaviour to vary from barriers to horizontal flow at the low end of the range to almost no impedance to horizontal flow at the high end of the range. It is very unlikely for the fault width to vary over more than an order of magnitude. Stochastically varying the fault width parameter would therefore have limited effect on the range of the flow entry resistance term as the fault hydraulic conductivity varies over four orders of magnitude.
The flow resistance within the fault is computed with a similar equation as the one for flow entry resistance. The fault width, however, is replaced with the fault height, the vertical extent of the fault plane. In line with the discussion of the stochastic fault generation (Section 2.6.2.3.5), these are nominally set to 100 m for subseismic faults and 1000 m for major faults. The range of vertical hydraulic conductivity is the same as for horizontal hydraulic conductivity. Stochastically varying the fault height parameter would again have limited effect on the range of the flow resistance term as the fault hydraulic conductivity varies over four orders of magnitude. The wide range of conductivity allows the faults to act as conduits of flow vertically or as barriers, again reflecting the current limited understanding of fault hydraulic behaviour in this region.

Product Finalisation date
- 2.6.2.1 Methods
- 2.6.2.2 Review of existing models
- 2.6.2.3 Model development
- 2.6.2.4 Boundary and initial conditions
- 2.6.2.5 Implementation of coal resource development pathway
- 2.6.2.6 Parameterisation
- 2.6.2.7 Observations and predictions
- 2.6.2.8 Uncertainty analysis
- 2.6.2.9 Limitations and conclusions
- Citation
- Acknowledgements
- Currency of scientific results
- Contributors to the Technical Programme
- About this technical product


