- Home
- Assessments
- Bioregional Assessment Program
- Gloucester subregion
- 2.6.2 Groundwater numerical modelling for the Gloucester subregion
- 2.6.2.3 Model development
- 2.6.2.3.2 Hydrogeological conceptual model
The conceptual understanding of the Gloucester subregion is defined in companion product 2.3 (Dawes et al., 2018) and summarised in Section 2.6.2.1 and Figure 3. This section pertains to the conceptualisation of groundwater flow in the deeper sedimentary layers and the surface weathered and fractured rock layer, in function of the earlier defined objectives for the analytic element model. The section also describes the conceptualisation of flow in the alluvium and the interaction with the surface weathered and fractured rock layer for the alluvial groundwater models of the Avon and Karuah.
2.6.2.3.2.1 Analytic element model
The bedrock underneath the alluvium and outcropping outside the alluvial extent in the Gloucester Basin cannot be considered as an aquifer system in the traditional sense. This is due to the overall low permeability of the sedimentary rocks and the absence of clearly defined hydrostratigraphic units that can be considered as aquifers. Flow in this sedimentary sequence is dominated by secondary permeability generated through faults and fractures (see companion product 1.1 for the Gloucester subregion (McVicar et al., 2014)). Particularly in the weathered zone at the top of the sedimentary sequence, this secondary permeability is locally high enough to allow water to be produced from bores for stock and domestic water use.
A common conceptualisation of groundwater flow through faults and fractures is that faults act as barriers to flow perpendicular to the fault plane, while in the plane parallel to the fault they can act as conduits (Fachri et al., 2013; Bense et al., 2013). The resistance to flow in the plane perpendicular to the fault, often in the horizontal direction, can arise from the juxtaposition of permeable and less permeable units and from the occurrence of a clay-rich fault gauge in the core of the fault zone (Loveless et al., 2011). The fracturation and brecciation of the fault zone, however, can provide enhanced hydraulic conductivity in the plane parallel to the fault plane, often in the vertical direction (Loveless et al., 2011). Recent investigations of local hydrogeological behaviour of fault zones in the Gloucester subregion (Parsons Brinckerhoff, 2015) indicate that the juxtaposition of coal seams to interburden units by faulting leads to compartmentalisation of coal seams. This points to faults acting as barriers to flow in the horizontal direction. A 29-day pump test in the Waukivory fault zone did not provide any indication that faults act as conduits vertically in the Gloucester subregion. Despite the results of this pumping test, the conceptualisation of faults as horizontal barriers to flow and vertical conduits is adopted. This choice is mostly driven by the adoption of the precautionary principle; faults acting as vertical conduits provide a pathway for depressurisation at depth to migrate rapidly to the shallower stratigraphic units. Not representing this feature could lead to underestimating drawdown in the surface weathered and fractured rock layer. The probabilistic parameterisation of the vertical and horizontal hydraulic conductivities of the fault features (Section 2.6.2.6), however, allows for faults to range from conduits in the vertical to features with hydraulic properties indistinguishable from the interburden.
Hydraulic conductivity has been observed to decrease with depth in this basin (see Parsons Brinckerhoff, 2015, Figures 7.1, 7.2 and 7.3). While there are insufficient observations of the storage coefficient to empirically deduce a similar relationship for storage, it assumed storage also decreases with depth. This is discussed in greater detail in Section 2.6.2.6.
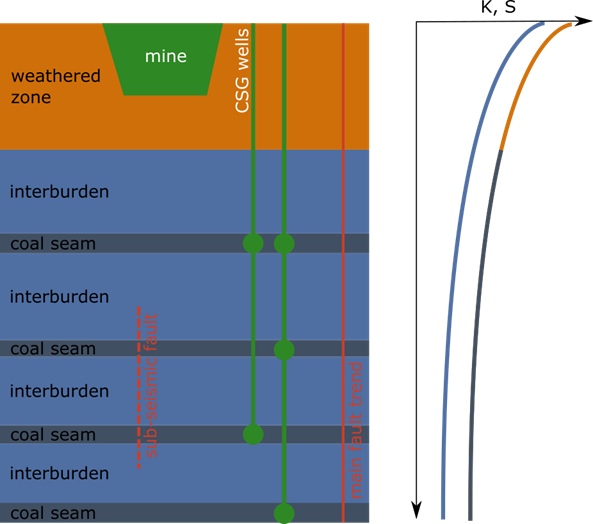
The groundwater system is therefore conceptualised as a sedimentary basin with hydraulic properties that vary as a function of depth rather than as a function of stratigraphy. The top of the sequence is the surface weathered and fractured rock layer with a higher hydraulic conductivity and storage than the unweathered rock. The sedimentary rocks, in this context referred to as interburden, are interspersed with horizontal, thin coal seams with higher hydraulic conductivity and storage than the interburden (Figure 8).
K = hydraulic conductivity; S = storage; CSG = coal seam gas
Graph illustrates the decrease of K and S with depth where colours in the graph correspond to the colour of hydrostratigraphic unit in the diagram on the left.
Throughout the interburden and the coal seams, major faults and subseismic faults are present. Major faults are defined as faults that can be identified on seismic sections, while subseismic faults are smaller faults beyond the resolution of the seismic section. Major faults are considered to affect the entire sedimentary sequence, while the vertical extent of the subseismic faults is limited. Both types of faults are conceptualized as horizontal barriers to flow while being potential vertical conduits. The major faults form the lateral boundaries of the modelled system.
In reality the coal seams are not horizontal or continuous. The sparsity of data and highly heterogeneous nature of the coal seams do not allow representation of the individual coal seams exactly in the model. Although this conceptualisation does not fully represent the geometrical complexity of the coal seams, the implementation of major and subseismic faults allows for depressurisation from CSG production to be propagated not only horizontally through the coal seam and vertically through the sedimentary column, but it also allows propagation throughout the entire sedimentary column rapidly via the faults. Through the same mechanism, the horizontal propagation is hindered by faults, representing compartmentalisation of the coal seams.
The aim of this model is to simulate a change in groundwater levels due to coal resource development rather than reproduce historical observations. In this predominantly confined system, the principle of superposition is valid and therefore initial conditions in groundwater level are assumed to be equal to the top of the model, throughout the model. Recharge is not accounted for in this model. Any recharge to the groundwater system will mitigate the drawdown caused by coal resource development. Not accounting for recharge will therefore only over estimate, not under estimate, the drawdown.
2.6.2.3.2.2 Alluvial MODFLOW models
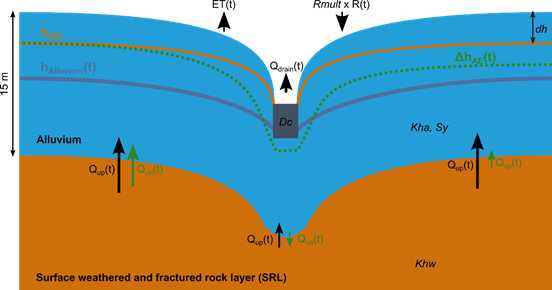
The mapped alluvium in the Gloucester subregion forms two contiguous units: a northern unit for the Gloucester and Avon rivers (referred to as the Avon model), and a southern unit for the Karuah and Mammy Johnsons rivers (referred to as the Karuah model). The conceptualisation of the groundwater flow in function of the objectives is the same for both units and is illustrated in Figure 9.
In both cases, the alluvial unit is very thin (circa 7 to 15 m) compared to the vertical extent of the sedimentary basin (circa 250 to 1000 m). The alluvial unit is not completely uniform, consisting of a series of layers and lenses of grades of material from sand to clay. At the regional scale, however, there is no consistent set of measurements or descriptions of the alluvial material that allow imposition of any specific spatial pattern or structure on the MODFLOW parameters. For this reason, both the thickness and physical properties of the alluvium are considered uniform across the model domain.
hAlluvium(t) = spatio-temporal groundwater level in alluvial aquifer; hSRL = specified head boundary, constant in time, in the surface weathered and fractured rock layer; ΔhAE(t) = spatio-temporal change in groundwater level in the surface weathered and fractured rock layer, simulated by the analytic element model; Qup(t) = spatio-temporal exchange flux between alluvium and surface weathered and fractured rock layer; Qdrain(t) = spatio-temporal drainage flux; R(t) = spatio-temporal recharge flux; ET(t) = spatio-temporal evapotranspiration flux; Khw = hydraulic conductivity of surface weathered and fractured rock layer; Kha = hydraulic conductivity of alluvium; Sy = specific yield of the alluvium; Rmult = recharge multiplier; Dc = hydraulic drainbed conductance; dh = depth to the specified groundwater level in the surface weathered and fractured rock layer.
Within the MODFLOW alluvial models, only two numerical layers are considered (Figure 9): the alluvium and the surface weathered and fractured rock layer. In the alluvial layer groundwater levels and fluxes are simulated. The top of the layer follows the topography from a 90 m digital elevation model (DEM) (Farr et al., 2007) and the layer is assigned a constant thickness of 15 m. The surface weathered and fractured rock layer provides a time-varying specified head lower boundary that interacts with the alluvial layer. The head difference between the specified head in the surface weathered and fractured rock layer and the head in the alluvial layer results in a spatio-temporal exchange flux between the alluvium and the weathered zone. The drawdown simulated in the surface weathered and fractured rock layer by the analytic element model underneath the alluvium is subtracted from this specified head. This results in a specified head boundary that varies in space and time. This change in groundwater level integrates the change in flow conditions caused by coal resource development as none of the coal resource developments extract water from the alluvium directly.
The main recharge mechanism is diffuse recharge while evapotranspiration occurs where the watertable is sufficiently close to the surface. The main discharge mechanism is through the river network. The river system is predominantly gaining, that is, the rivers drain the groundwater system.

Product Finalisation date
- 2.6.2.1 Methods
- 2.6.2.2 Review of existing models
- 2.6.2.3 Model development
- 2.6.2.4 Boundary and initial conditions
- 2.6.2.5 Implementation of coal resource development pathway
- 2.6.2.6 Parameterisation
- 2.6.2.7 Observations and predictions
- 2.6.2.8 Uncertainty analysis
- 2.6.2.9 Limitations and conclusions
- Citation
- Acknowledgements
- Currency of scientific results
- Contributors to the Technical Programme
- About this technical product


