2.6.2.7.2.1 Drawdown due to the additional coal resource development
As discussed in Section 2.6.2.1, one objective of the groundwater modelling is to provide probabilistic estimates of the drawdown of the watertable due to the additional coal resource development.
At each model node (shown in Figure 3), time series of groundwater level in the watertable aquifer are simulated for the baseline and CRDP, noting that one baseline and five additional coal resource developments were not modelled and results therefore do not provide a complete picture of the changes due to the additional coal resource development. The maximum difference in drawdown between the CRDP and baseline, due to additional coal resource development (dmax)), and the year of maximum change (tmax), are calculated based on the difference between the two time series. This is illustrated in Figure 24 for two model nodes: probe66 and GW044912.
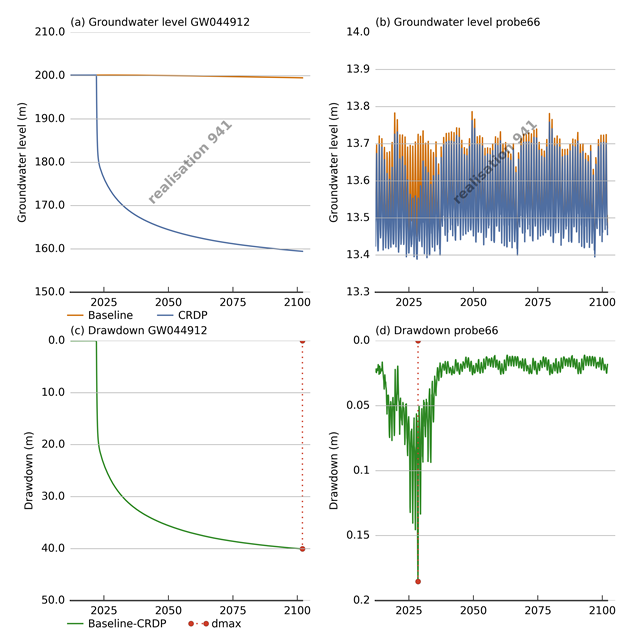
Groundwater levels in (a) and (b) are expressed as mAHD.
dmax = maximum difference in drawdown between the coal resource development pathway (CRDP) and baseline, due to additional coal resource development (ACRD)
CRDP = baseline + ACRD
Data: Bioregional Assessment Programme (Dataset 2)
2.6.2.7.2.2 Change in surface water – groundwater flux due to the additional coal resource development
The difference in the surface water – groundwater flux due to the additional coal resource development is simulated for points along the groundwater model stream network shown in Figure 3 in Section 2.6.2.1. The surface water – groundwater fluxes upstream of each surface water model node in Figure 3 in Section 2.6.2.1 are aggregated at the node. The resulting flux time series are inputs to the surface water modelling, as documented in Section 2.6.2.1 and in greater detail in companion product 2.6.1 for the Hunter subregion (Zhang et al., 2018).
Generally, the extraction of water by coal mines causes baseflow to decrease. However, the modelling indicates that mining can also increase baseflow. This is due to hydraulic conductivity enhancement above underground mines and is explained in more detail here.
A simple two-dimensional groundwater model, also run using MOOSE and shown in Figure 25, was developed to illustrate the effect of conductivity enhancement and mine water extraction on baseflow and evapotranspiration. In the model, groundwater is recharged by rainfall and loses water via evapotranspiration at the surface, while the other boundaries are impermeable. A stream at the bottom of the hillslope receives groundwater as baseflow. The position of the watertable prior to mining is shown in Figure 25. It is deeper near the top of the slope, beyond the depth of evapotranspiration, but shallows towards the stream such that at some depth to watertable evapotranspiration becomes important. An underground mine is represented by a zone of conductivity enhancement (shown in red in Figure 25).
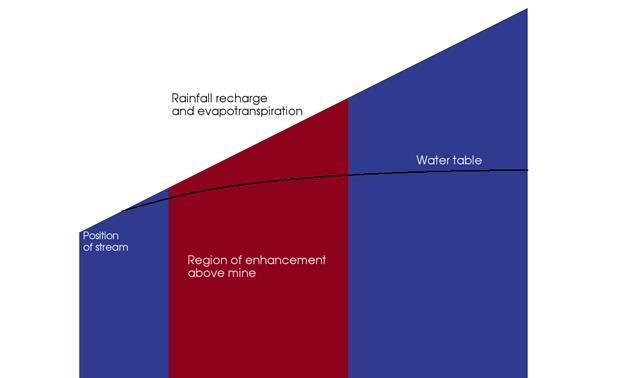
Figure 25 A two-dimensional groundwater model
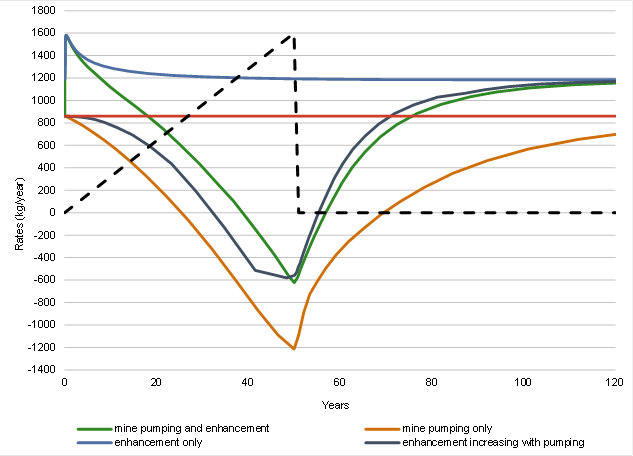
The model is subjected to groundwater pumping from the mine, assumed to increase linearly from zero to some maximum rate over 50 years (dashed black line in Figure 26). Figure 26 shows the changes in baseflow to the stream over 120 years for a number of different schemes relative to a no-mine-pumping, no-hydraulic-enhancement baseflow (red line):
- Scheme 1: conductivity is enhanced above the entire mine footprint at the commencement of pumping (green line). This is the scheme used in the Hunter subregion groundwater model. It is incorrect on the local scale, as the collapsed zone with higher conductivity only occurs above mined longwall panels, not above unmined sections.
- Scheme 2: there is no conductivity enhancement, only mine pumping (orange line). This is similar to the effect of an open-cut mine.
- Scheme 3: conductivity is enhanced over the entire mine footprint at the commencement of mining, but there is no groundwater pumping (blue line).
- Scheme 4: the conductivity enhancement is phased in over time at a rate equal to the change in groundwater pumping over time by the mine (navy blue line). This is consistent with the expansion of the collapsed zone over time and with pumping rates being dependent on the area impacted by hydraulic enhancement.
In all schemes, the hydraulic conductivity enhancements are assumed to be permanent. In the pumping scenarios, pumping ceases at the cessation of mining (at t = 50 years).
The model does not represent potential changes in recharge from hydraulic enhancement. The physical subsidence of the land surface above longwall panels has not been included in the groundwater modelling, but may affect surface water routing (represented in the surface water modelling), groundwater flow and baseflow. Ponding in the subsided area could alter the local groundwater recharge pattern and have an effect on baseflow to streams.
Data: Bioregional Assessment Programme (Dataset 3)
Figure 26 shows that when hydraulic enhancement is not represented in the model (scheme 2), pumping will cause baseflow to reduce for the duration of pumping, but will gradually recover once pumping ceases. Figure 26 also shows that when the full effect of hydraulic enhancement is introduced at the commencement of mining (schemes 1 and 3), this results in an initial ‘slug’ of groundwater to the stream. The hydraulic enhancement causes stored groundwater to flow more rapidly in the direction of the stream, which causes an increase in the pressure head at the interface with the non-hydraulically enhanced area, leading to more baseflow to the stream. As pumping increases (scheme 1), this slug of baseflow is offset by watertable lowering above the mine and the creation of a hydraulic gradient towards the mine, which reduces the flow of groundwater to the stream. In the absence of pumping (scheme 3), the initial slug decays to a new equilibrium baseflow that is greater than the starting baseflow.
When the hydraulic enhancement is phased in as mining progresses (scheme 4), the initial baseflow slug can be offset by the effects of drawdown and there may be minimal impact on baseflow early on.
In schemes 1, 3 and 4, the final baseflow after mining has ceased is higher than the pre-mining baseflow. This is explained by reference to Figure 27, which shows the position of the watertable before mining (in black) and after hydraulic enhancement (in green). Above the mine, the watertable is almost horizontal because the higher conductivity above the mine means the rock is almost like a ‘tub’ containing water. In the Figure 27 example, much of the area has experienced a lowering of the watertable, which means there is less evapotranspiration from those areas. Since the rainfall recharge is unchanged, net recharge is increased, leading to more baseflow under the new steady state. This increased baseflow might possibly be saline.
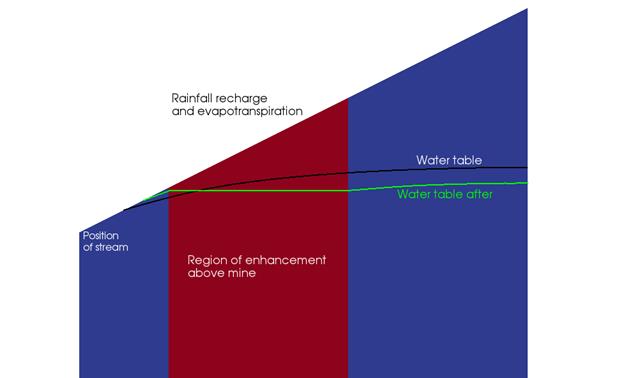
Figure 27 Position of the watertable before and after mining
This simple model illustrates the possibility for increased baseflows following mining. In site-specific, three-dimensional situations with realistic topography and complicated hydrogeology, and with temporal changes in rainfall and evapotranspiration, and with realistic longwall excavation patterns and retreat rates, the situation is much more complex for a stream at the local scale. Any section of any stream could follow any combination of schemes 1, 2, 3 and 4. Moreover, the models do not consider any change to porosity (storage) and water head due to the volumetric expansion of the overburden. These will naturally decrease the initial ‘slug’ of water, but will play no role in the long-term behaviour of baseflow.
Baseflow itself is difficult to measure, but related effects have been measured by Walker (1988) who conducted a study to assess the impact of longwall mining on shallow groundwater and found that after mining, the groundwater levels in 60% of observation wells equalled or exceeded the pre-mining levels.
In summary, there are three ways that baseflows can increase due to mining:
- In the short term, water stored in the interburden can be released as the groundwater finds a new equilibrium (this is modelled in the Hunter subregion groundwater model).
- When the groundwater’s new phreatic surface is deeper than prior to mining, resulting in less evapotranspiration for the same recharge (this is modelled in the Hunter subregion groundwater model).
- In the longer term, when a new equilibrium is established, the enhanced conductivity means that: (i) groundwater moves faster (this is modelled); and (ii) rainfall recharge is potentially higher (this is not modelled).
Various studies undertaken by CSIRO Energy of underground fluid flows coupled with rock deformation caused by longwall mining suggest increases in baseflow due to hydraulic enhancement are unlikely at distances greater than two times the width of the longwall panel from the longwall panel – i.e. it is a local effect.
To deal with the initial slugs in baseflow response that resulted from initiating hydraulic enhancements above longwall mines on day 1 of mining, the surface water – groundwater exchange flux simulations were modified to remove baseflow increases prior to being input into the AWRA-R model (reported in companion product 2.6.1 surface water modelling for the Hunter subregion (Zhang et al., 2018)). This also removed any longer-term baseflow increases resulting from hydraulic enhancement and changes in groundwater level, thus results reported in the surface water modelling represent only the changes caused by decreases in the flux of groundwater to streams, and it is these changes that are carried through to the impact and risk analysis in companion product 3-4 for the Hunter subregion (as listed in Table 2).
