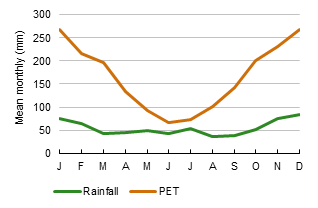
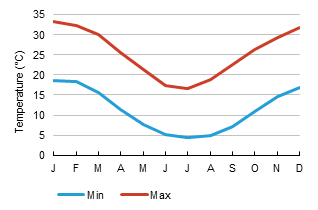
The climate of the subregion is characterised by hot, dry summers and cool winters. Maximum temperatures average 32 to 33 °C through the summer and 17 to 19 °C through the winter, while typical minimum temperatures in summer are 17 to 19 °C and 5 °C through winter (Figure 11). The Köppen classification system classes the western part of the subregion as hot and persistently dry, while the east is subtropical with a moderately dry winter.
|
(a) |
(b) |
|
|
|
Source data: derived from (i) Mean monthly and mean annual rainfall data (BoM, 2013a) and (ii) Mean monthly and mean annual maximum, minimum & mean temperature data (BoM, 2013b)
In the subregion, mean annual rainfall ranges from about 950 mm in the Mount Kaputar area to the south of Moree to about 500 mm south-west of Collarenebri (Figure 12). In the headwaters of the Gwydir and Border rivers, but outside of the subregion, mean annual rainfall exceeds 1200 mm in places. Figure 13 shows the annual time series of rainfall from 1900 to 2011 for the subregion. The annual mean for this period is 605 mm, but it can be seen that there is considerable variability with a low of 310 mm in 1902 and a maximum of 1185 mm in 1950. The orange line, which represents the low frequency trend for the record, shows that the years between 1900 and 1946 were on average drier (530 mm/year) than the latter half of the 20th century (650 mm/year). The millennium drought is not evident in the subregion with the rainfall mean of 605 mm for 2002 to 2009 being the same as that for the full record, although the second driest year since 1900 was in 2002. Rainfall is summer-dominant, varying from 225 mm (75 mm/month) for the December to February period to 135 mm (45 mm/month) between June and August (Figure 11).
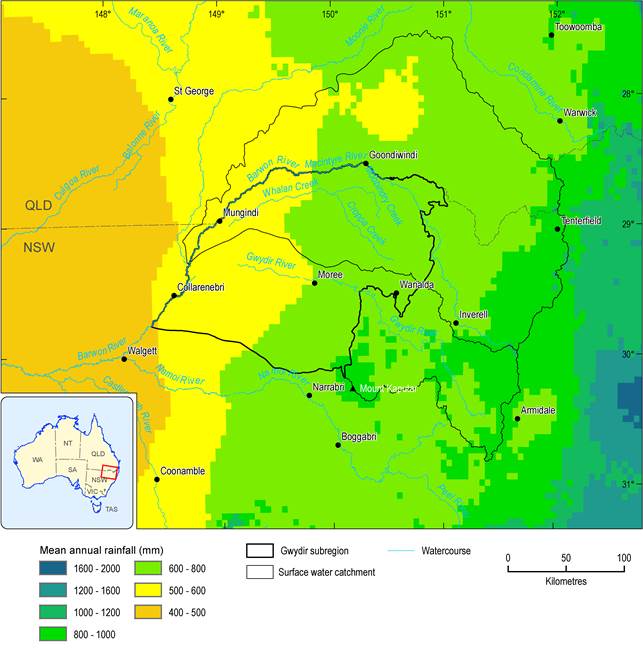
Figure 12 Mean annual rainfall
Source data: BoM (2013c)
Potential evapotranspiration (PET) was calculated on a daily time step using the Penman method with a wind spline for the period 1981 to 2012. The spatial pattern of mean annual PET for this period is shown in Figure 14 and ranges from 1925 mm to 2180 mm across the subregion. Higher rates occur to the west of the subregion and lower rates in the higher elevation, higher rainfall areas to the east. The mean monthly PET varies between 65 mm in June and 265 mm in December and January, reflecting the annual temperature pattern. On average, potential evaporation is limited by water availability throughout the year (Figure 11), so actual evapotranspiration rates are not as high as potential rates.
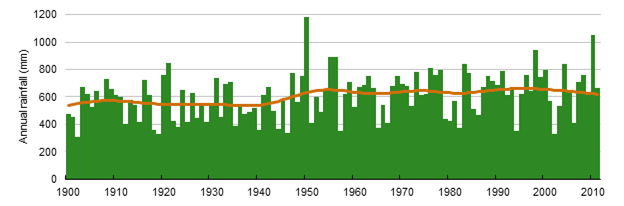
Figure 13 Annual rainfall for 1900 to 2011 averaged over the Gwydir subregion
Source data: BoM (2013c)
The orange line shows the low frequency variability.
In a recent report by the South Eastern Australia Climate Initiative (SEACI) (CSIRO, 2010), the significance of the 1997 to 2009 period was assessed relative to other recorded droughts since 1900 and as an indicator of what the future climate might look like. While it was found that this period was the driest in the 110+ year record for the south-eastern corner of Australia with rainfall 5 to 30% less than the 1895 to 2008 mean, in the Border Rivers-Gwydir subregion, the rainfall was either within 5% or 5 to 20% greater than the long-term mean. Modelled streamflow was estimated to be 5 to 50% greater than the long-term mean across much of the subregion, with only the most westerly areas experiencing runoff reductions. In general, analysis has shown that the impact upon streamflow of a small percentage change in rainfall is enhanced with a 5% reduction in mean rainfall leading to a 10 to 15% reduction in streamflow and a 5% increase in rainfall leading to a 10 to 15% increase in streamflow in south-eastern Australia (Chiew, 2006).
However, the most recent analysis of likely future climate for the region suggests that the probability of runoff reductions is greater than 50%. Post et al. (2012) modelled future runoff at a 5 km grid resolution for south-eastern Australia. The climate series was informed by simulations from 15 global climate models used in the Intergovernmental Panel on Climate Change (IPCC) Fourth Assessment Report, taking into account changes in daily rainfall distributions and seasonal rainfall (and potential evapotranspiration) amounts, for an increase in global mean surface air temperature of 1.0 °C (2030 relative to 1990), and 2.0 °C (2070 relative to 1990). In the Gwydir river basin (including headwaters), the median projection under 1.0 °C of warming is for a 3% reduction (–19 mm) in rainfall (Table 7) and 10% reduction (–4 mm) in runoff (Table 8). In the more northerly Border Rivers river basin, the median projection is a 5% reduction (–31 mm) in rainfall (Table 7) with a 14% reduction (–4 mm) in runoff (Table 8). Across all models, the potential evaporation is projected to increase in the Border Rivers-Gwydir river basins by 2 to 5% by 2030.
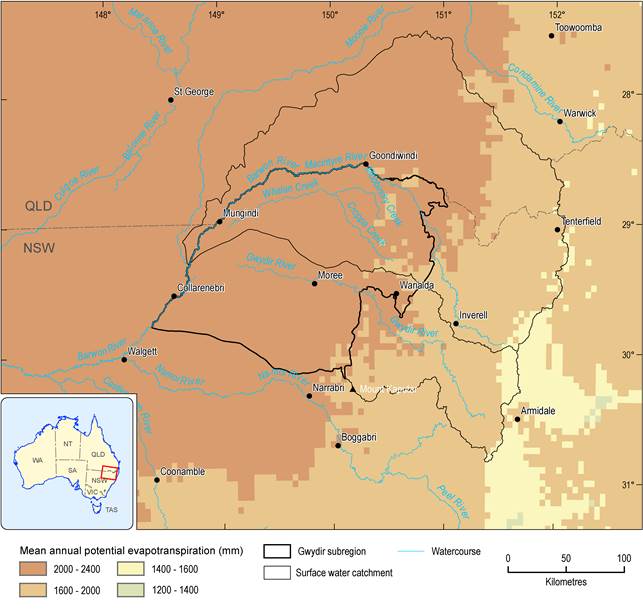
Figure 14 Mean annual potential evapotranspiration
Source data: Donohue et al. (2010)
Table 7 Summary of projected impacts of climate change on rainfall for the broad vicinity of the Gwydir subregion
Source data: Table 2 in Post et al. (2012)
GCM is global climate model
Table 8 Summary of projected impacts of climate change on runoff for the broad vicinity of the Gwydir subregion
Source data: Table 3 in Post et al. (2012)
GCM is global climate model
Figure 15 shows the distribution of rainfall and runoff changes across the year for the historical record (1895 to 2006) and projected changes at Moree. Projected decreases in winter rains will probably result in reduced runoff, while small increases in January and February rain will increase runoff, although there is greater uncertainty in the projections for both rainfall and runoff during January and February. The wider range of projections for runoff than rainfall indicate greater uncertainty in the runoff projections. In particular, the summer and winter runoff projections show much greater variability amongst the global climate models than those for autumn and spring.
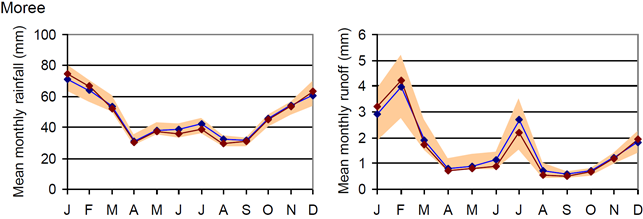
Source: Figure 18 in Post et al. (2010)
The implications of a changing climate were considered in the Murray-Darling Basin Sustainable Yields Project for the Gwydir river basin (CSIRO, 2007a) and the Border Rivers river basins (CSIRO, 2007b) in 2030 based on IPCC Fourth Assessment climate change projections and assuming current levels of development. While the mean runoff reduction forecast for these river basins was 9%, slightly less than the 11% and 14% reductions projected in the more recent SEACI report, the assessment of impacts remains relevant. Table 9 summarises impacts on the water resource and wetland inundation events for the median, dry and wet forecast scenarios. For a 9% reduction in runoff and assuming no new development in the river basins (e.g. no construction of new water storages or significant land cover change), the CSIRO estimated a 10% reduction in water availability in both systems, a 6% reduction in end-of-system flows in the Gwydir and a 12% reduction in Border Rivers, and 8% and 2% reductions in diversions in the Gwydir and Border rivers, respectively. The impact on diversions depends on the class of water: town water would be unaffected by the changes, general security diversions would reduce by 9% (Gwydir) and 1% (Border Rivers) and high security water diversions would increase by 3% (Gwydir).
Under the median future climate, the frequency of large inundation events of the Gwydir Wetlands is expected to remain largely unchanged, but overall flood volumes are projected to decrease, with negative implications for the scale of bird breeding events. At the dry extreme of the climate projections, the interval between large scale wetland inundations is predicted to increase by more than 50% (from 15 months to 3.5 years) with serious impacts on the wetland ecology and potential loss of species (CSIRO, 2007a). In the Border Rivers river basin, the interval between flooding of the anabranches and billabongs on the floodplains between Goondiwindi and Mungindi is projected to increase by 26% under the median scenario, with the mean volume of flood waters reducing by 22%. When flooded, these areas provide large amounts of dissolved organic carbon to the riverine ecosystem which is essential to aquatic ecosystem functioning. Any climate future between the median estimate and the dry extreme would lead to extended periods without hydrological connectivity between the lower Macintyre River and its floodplain and smaller volumes of water which would likely affect instream processes due to reductions in the availability of dissolved organic carbon.
Recharge of the Great Artesian Basin (GAB) intake beds, the GAB alluvium and the Border Rivers alluvium is not projected to change significantly under the median scenario (–1, +2 and +1%, respectively), but with significant increases (+22%) in the Lower Gwydir alluvium (CSIRO, 2007a; CSIRO, 2007b).
It is important to remember that there are considerable uncertainties in the climate change projections and this makes definitive conclusions about the direction and magnitude of changes on water resources difficult to make. However, the SEACI modelling suggests even drier ‘best’ estimates than the earlier studies, so the weight of evidence is for a shift to drier conditions.
Table 9 Projected impacts of climate change on water resources and wetland inundation in 2030 relative to the historical average (1895–2006)
Source data: Tables 4-6, 4-7 and 7-5 in CSIRO (2007a), and Tables 4-6, 4-7 and 7-5 in CSIRO (2007b)
