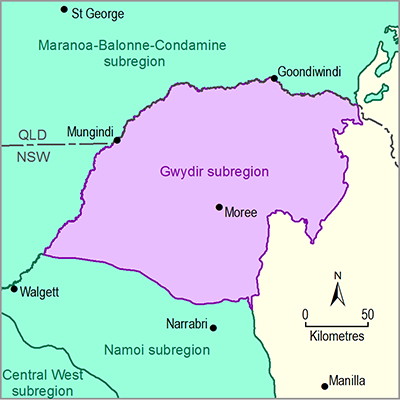
The surface water quality indicators given by the percentage of samples exceeding Australian and New Zealand Environment and Conservation Council (ANZECC) water quality guidelines for the protection of the aquatic ecosystems (ANZECC and ARMCANZ, 2000) for turbidity and total phosphorus for 2005 to 2008 at 18 locations within the subregion and at three locations just outside the subregion are shown in Table 13. The guideline values for total phosphorus are 0.02 mg/L for upland sites (>150 m above mean sea level) and 0.05 mg/L for lowland sites. The corresponding values for turbidity are 25 and 50 nephelometric turbidity units (NTU), respectively (NSW Government, 2010). Table 13 shows that at eight locations more than 90% of the samples, and for all locations more than 50% of the samples exceeded the limit for total phosphorus. In contrast, more than 90% of the samples exceed the limit for turbidity at only two locations. No meaningful correlation between the percentage of sites exceeding limits for these two water quality indicators was found.
The NSW Office of Water monitors ambient river water quality at strategic locations and maintains long-term datasets for sites across the Central West. Attributes currently monitored represent general water quality condition and are most likely to demonstrate change over time from a broad-scale implementation of natural resource management perspective (e.g. turbidity, total nitrogen, total phosphorus, electrical conductivity, pH and water temperature) (W Mawhinney, 2014, pers. comm.).
Not all stations in the region record all water quality indicators. Table 14 summarises results of water quality assessments for the Border Rivers and Gwydir river basins based on 33 and 24 sites, respectively (not necessarily all within the subregion). For both river basins water quality in terms of turbidity is rated ‘fair’, while pH and salinity are rated ‘fair’ only for the Border Rivers. All the remaining water quality indicators listed in the table are rated ‘poor’ to ‘very poor’ for both river basins. The nutrients (total nitrogen and total phosphorus) for both basins are rated ‘very poor’ (SEWPAC, 2011). A ‘poor’ rating means that between 25 and 50% of samples complied with ANZECC/ARMCANZ (2000) guidelines for protection of the aquatic ecosystem, and those with less than 25% compliance are classified as ‘very poor’. The overall ecosystem health of both the Border Rivers and Gwydir river basins as reported by the Sustainable Rivers Audit (SRA) is rated as ‘poor’ for both the 2004 to 2007 and 2008 to 2010 periods (MDBC, 2008; Davies et al., 2012). Note that the data in Table 13 and Table 14 and ratings (e.g. ‘poor’) for individual water quality indicators were assessed against the ANZECC and ARMCANZ (2000) water quality guidelines and not against the Basin Plan water quality targets which will be used in the future (W Mawhinney, 2014, pers. comm.). The overall ecosystem health were based on SRA assessments.
The Horton River, and the Myall, Warialda and Tycannah creeks have high salt concentrations (CSIRO, 2007). Analysis for this report using data from NSW Government (2014b) showed that the median of monthly mean of daily electrical conductivity (EC) at a station in the Gwydir river basin (Mehi River at Bronte, 418058) for 2001 to 2013 was 445 mS/cm (10th and 90th percentile values are 257 and 708 mS/cm, respectively). The daily mean water temperature ranges from 10 to 31°C. For a station in the Border Rivers Basin (Macintyre River at Holdfast, 416012) the median of mean monthly EC is 275 mS/cm (10th and 90th percentile values are 208 and 381 mS/cm, respectively) and the mean daily temperature ranges from 10 to 42°C (the second-highest value is 34 °C). Trend analysis showed stable trends for EC and water temperature and a rising trend for turbidity in the Mehi River at Bronte. The same results, except with a falling trend for EC, were found for the Macintyre River at Holdfast (NSW Government, 2010).
Table 13 Percentage of samples that exceeded Australian and New Zealand Environment and Conservation Council guidelines for total phosphorus and turbidity at different locations within and outside (in italics) of the Gwydir subregion
Source data: NSW Government (2010)
Table 14 Water quality assessment for Border Rivers and Gwydir River
|
River basin |
Sites |
Turbidity |
Salinity |
pH |
TN |
TP |
|---|---|---|---|---|---|---|
|
Border Rivers |
33 |
Fair |
Fair |
Fair |
Very poor |
Very poor |
|
Gwydir |
24 |
Fair |
Poor |
Poor |
Very poor |
Very poor |
Source data: SEWPaC (2011)
TN is total nitrogen and TP is total phosphorus

