The hydrological response variables modelled in the Gloucester subregion are shown in Table 5. Of these, three were chosen to represent the potential impacts due to additional coal resource development on the low-flow (low-flow days (LFD)) and high-flow (high-flow days (FD)) components of the flow regime and the average change in streamflow (annual flow (AF)).
The following maps and tables include streams with ‘potential hydrological change’. These are reaches where results from the model nodes cannot be extrapolated to the reach, but where the downstream node indicates an above threshold change in that hydrological response variable (as defined in Table 5). Some reaches show potential hydrological change because they are in the same catchment as the additional coal resource development and are thus likely to be impacted. Some reaches show potential hydrological change because they are within the area of greater than 0.2 m drawdown. Since the extent of the greater than 0.2 m drawdown area varies from the 5th to 50th to 95th percentiles (see Figure 16), streams that show potential hydrological change at the 95th percentile do not necessarily show potential hydrological change at the 50th or 5th percentiles.
The potential changes in streamflow due to the baseline coal resource development are not presented spatially because of difficulties in interpolating baseline values from nodes to links and because baseline values of the hydrological response variables are only available for the year in which the maximum change in each hydrological response variable due to the additional coal resource development occurs. A spatial map might therefore have annual flow from 2021 at one location and 2067 at another location, rendering comparisons meaningless. As a result of this, changes due to additional coal resource development are considered in the context of the interannual variability under the baseline, a far more robust and meaningful measure. Unlike groundwater, streamflow characteristics are extremely sensitive to climate, particularly the variability in rainfall over relatively short time-scales.
A number of hydrological response variables were defined to represent changes in ecologically important components of the flow regime for the purposes of the receptor impact modelling (see companion submethodology M08 (as listed in Table 1) for receptor impact modelling (Hosack et al., 2018b)). Changes in these variables due to additional coal resource development are presented in Section 3.4 in the context of impacts on landscape classes. The risk to water-dependent landscape classes and assets from hydrological changes due to the additional coal resource development is related in large part to their resilience to a variable climate. Hydrological changes that push the flow regime beyond its ‘natural’ range are more likely to have an impact on these water-dependent systems than changes that are well within that ‘natural’ range.
3.3.3.1 Low-flow days
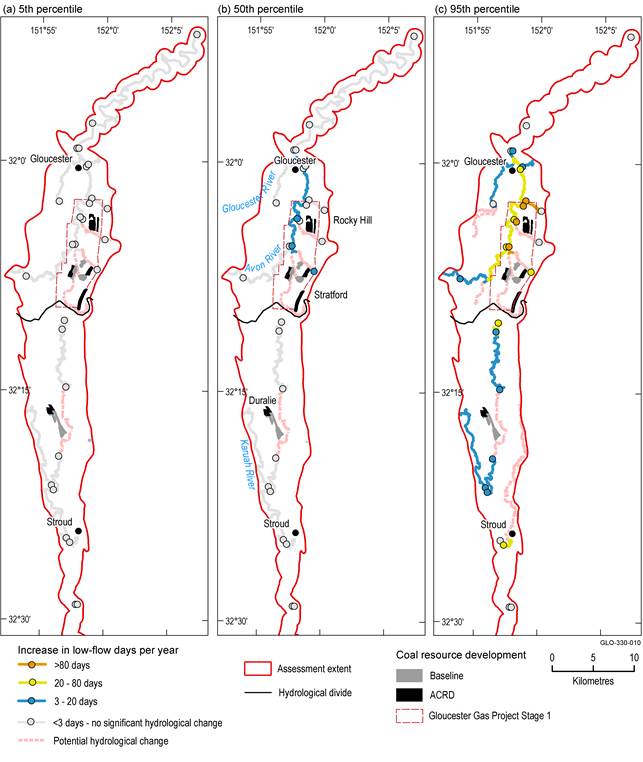
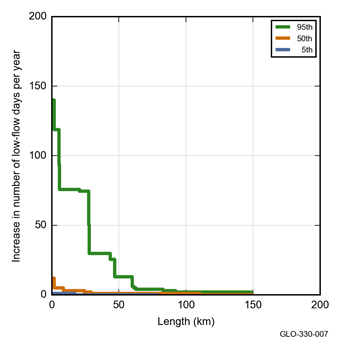
The increases in the number of low-flow days due to additional coal resource development in the Gloucester subregion are shown in Figure 20. A cumulative exceedance plot of these increases in low-flow days is shown in Figure 21, while the underlying data are presented in Table 8.
The extent of the mines in the CRDP is the union of the extents in the baseline and in the ACRD.
Data: Bioregional Assessment Programme (Dataset 1)
Figure 20 shows that at the 5th percentile, it is unlikely that there are increases of at least 3 low-flow days per year anywhere in the assessment extent, although there are a couple of streams that pass close to the Rocky Hill, Stratford and Duralie mines where potential impacts are unable to be ruled out. At the 50th percentile, there are streams near the Rocky Hill mine that experience an extra 3 to 20 low-flow days per year, and there are other streams where potential impacts are unable to be ruled out. At the 95th percentile there are large increases in the number of low-flow days near Rocky Hill and Stratford mines, and smaller increases due to the mine extension at Duralie. Note that any potential impacts due to the Gloucester Gas Project would be limited to the area around Rocky Hill and Stratford, as this is the proposed Stage 1 CSG field area.
Data: Bioregional Assessment Programme (Dataset 1)
Table 8 Stream length (km) potentially exposed to varying increases in low-flow days due to additional coal resource development in the Gloucester and Karuah river basins
The stream length potentially exposed to increases in low-flow days (LFD) is shown for the 5th, 50th and 95th percentiles. The increase due to additional coal resource development is obtained by subtracting the results under the baseline from the results under the coal resource development pathway (CRDP).
Data: Bioregional Assessment Programme (Dataset 1)
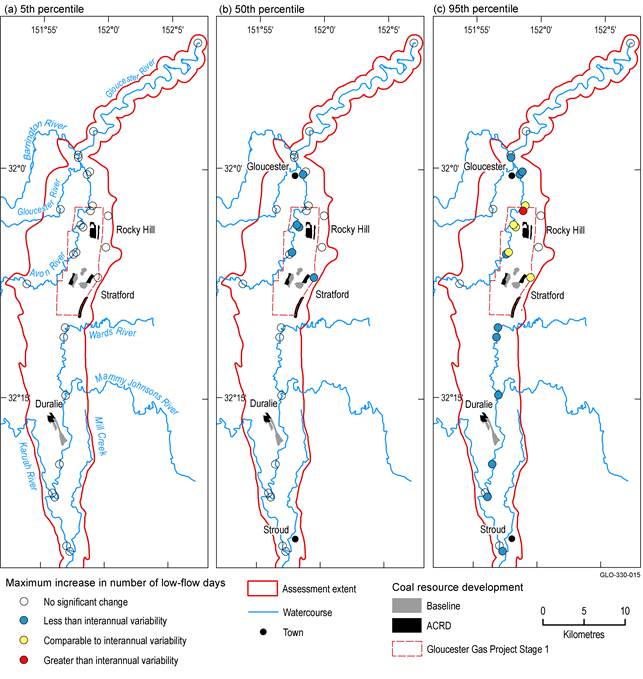
To understand the significance of the modelled increases in low-flow days, it is useful to look at them in the context of the interannual variability in low-flow days due to climate. In other words, are the modelled increases due to additional coal resource development within the natural range of variability of the longer-term flow regime, which would suggest the system is adapted to the range of possible increases, or are they potentially moving the system outside the range of hydrological variability it experiences under the baseline? The maximum increase in the number of low-flow days due to additional coal resource development relative to the interannual variability in low-flow days under the baseline has been adopted to put some context around the modelled changes. This ratio is shown qualitatively for each surface water model node in Figure 22. Table 9 provides the ratio ranges for LFD, FD and AF adopted for each qualitative ratio class shown in Figure 22. It is important to be aware that the changes shown in Figure 22 represent the maximum change due to additional coal resource development in a single year relative to the interannual variability across 90 years under the baseline. Thus, it is not a comparison of distributions, but an assessment of whether the change due to additional coal resource development, in the year of maximum difference between the CRDP and the baseline, is within the range of natural variability. If the maximum change is small relative to the interannual variability due to climate (e.g. an increase of 3 days relative to a baseline range of 20 to 50 days; ratio of 0.1), then the risk of impacts from the changes in low-flow days is likely to be low. If the maximum change is comparable to or greater than the interannual variability due to climate (e.g. an increase of 200 days relative to a baseline range of 20 to 50 days; ratio of 6.7), then there is a greater risk of impact on the landscape classes and assets that rely on this water source. Here, changes comparable to or greater than interannual variability are interpreted as presenting a considerable risk. However, since the change due to the additional coal resource development is additive, even a ‘less than interannual variability’ change is not free from risk, and the results of this analysis should be viewed as indicators of risk.
Table 9 Ratio of increase in the number of low-flow days (LFD), high-flow days (FD) and annual flow volume (AF) due to additional coal resource development to the interannual variability in low-flow days under the baseline
FD = high-flow days – in previous products, this is referred to as ‘flood days’
Figure 22 indicates that at the 5th percentile, the increase in the number of low-flow days is not significant and unlikely to impact the interannual variability. At the 50th percentile, changes around and downstream of the Stratford, Rocky Hill and Gloucester Gas Project developments are less than interannual variability, but flag a potential risk. At the 95th percentile, the change in number of low-flow days is either comparable to or greater than interannual variability in this area, indicating potentially large changes in the low-flow regime, with some risk further downstream on the Avon River and in the Karuah River basin also. Section 3.4 and Section 3.5 provide an assessment of the potential impacts of the modelled hydrological changes on ecosystems and assets.
The extent of the mines in the CRDP is the union of the extents in the baseline and in the ACRD.
Data: Bioregional Assessment Programme (Dataset 1)
3.3.3.2 High-flow days
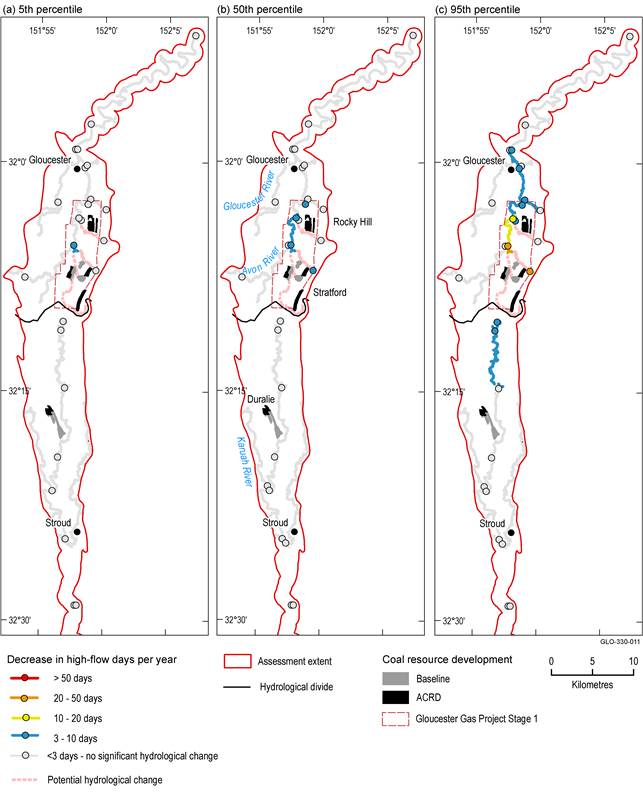
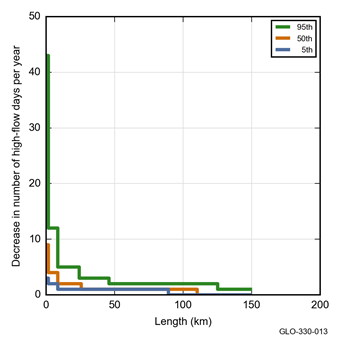
The decrease in the number of high-flow days due to additional coal resource development in the Gloucester subregion is shown in Figure 23. A cumulative exceedance plot of these decreases in high-flow days is shown in Figure 24, while the underlying data are presented in Table 10.
Figure 23 shows that at the 5th percentile, there are only 1.7 km of stream downstream of the Stratford mine where there is a decrease of 3 to 10 high-flow days per year. There are also two streams that pass close to the Stratford and Rocky Hill mines where potential impacts are unable to be ruled out. At the 50th percentile, downstream of the Stratford mine there are 8.5 km of stream that may experience 3 to 10 fewer high-flow days per year, and there are other streams where potential impacts are unable to be ruled out. At the 95th percentile, there are large decreases in the number of high-flow days downstream of the Stratford and Rocky Hill mines, and smaller decreases in the stream flowing southwards in the Karuah river basin. Changes in this stream are due to potential impacts from the Stratford mine and the Gloucester Gas Project crossing the catchment divide into the Karuah river basin.
The extent of the mines in the CRDP is the union of the extents in the baseline and in the ACRD.
Data: Bioregional Assessment Programme (Dataset 1)
Data: Bioregional Assessment Programme (Dataset 1)
Table 10 Stream length (km) potentially exposed to varying reductions in high-flow days due to additional coal resource development in the Gloucester and Karuah river basins
The stream length potentially exposed to reductions in high-flow days (FD) is shown for the 5th, 50th and 95th percentiles. The reduction due to additional coal resource development is obtained by subtracting the results under the baseline from the results under the coal resource development pathway (CRDP).
Data: Bioregional Assessment Programme (Dataset 1)
The comparison of maximum change in high-flow days due to the additional coal resource development and interannual variability in high-flow days under the baseline (Figure 25) indicates that at the 5th and 50th percentiles, the decrease in the number of high-flow days is either not significant, or less than the interannual variability. There is a possibility that the Avon River and tributaries near Stratford and Rocky Hill mines and the Gloucester Gas Project could experience decreases in high-flow days of up to half the range due to interannual variability. At the 95th percentile, the decrease in number of high-flow days is comparable to interannual variability at one model node downstream of the Stratford mine. This indicates a potential for localised changes in high-flow days outside the baseline range due to climate.
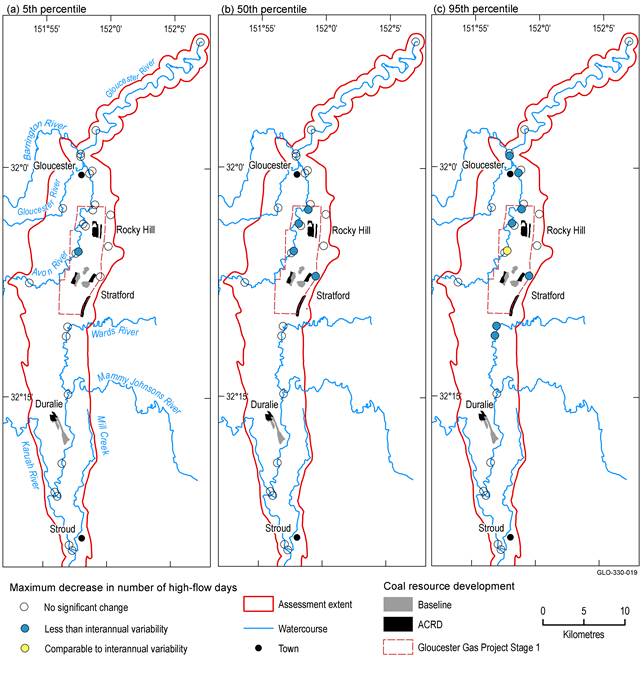
The extent of the mines in the CRDP is the union of the extents in the baseline and in the ACRD.
Data: Bioregional Assessment Programme (Dataset 1)
3.3.3.3 Annual flow
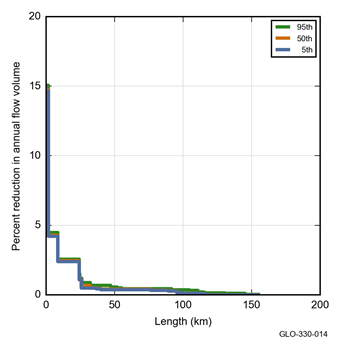
The decrease in annual flow due to additional coal resource development in the Gloucester subregion is shown in Figure 26. A cumulative exceedance plot of these decreases in annual flow is shown in Figure 27, while the underlying data are presented in Table 11.
Figure 26 shows that the reductions in annual flow are identical at the 5th, 50th, and 95th percentiles. This is because the reductions in annual flow are driven primarily by the area of overland flow intercepted by the open-cut mine pits, which is not included in the uncertainty analysis. There are 1.7 km of stream with a little over 5% reduction on Dog Trap Creek downstream of the Stratford mine and an additional 24 km of stream with 1% to 5% reduction further downstream, on the Avon River.
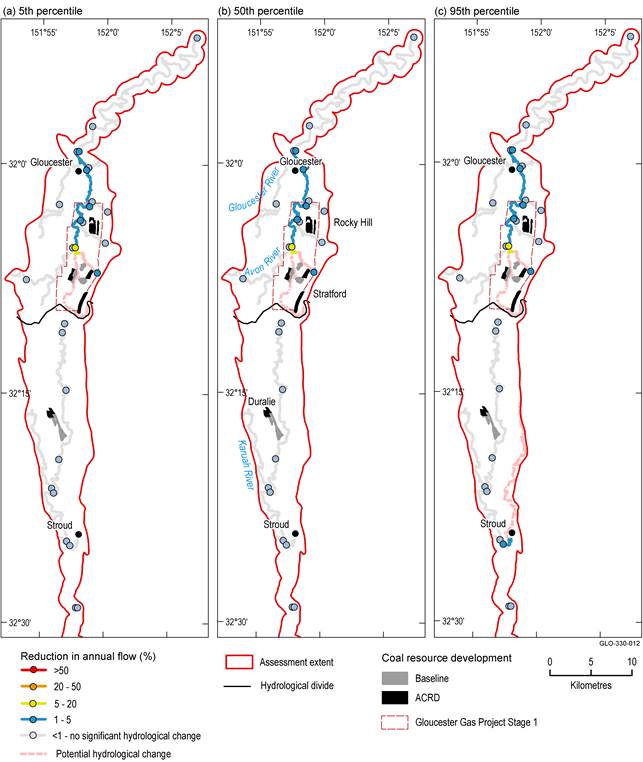
Figure 26 Decrease in annual flow (AF) due to additional coal resource development (ACRD)
The extent of the mines in the CRDP is the union of the extents in the baseline and in the ACRD.
Data: Bioregional Assessment Programme (Dataset 1)
Data: Bioregional Assessment Programme (Dataset 1)
Table 11 Stream length (km) potentially exposed to varying reductions in annual flow due to additional coal resource development in the Gloucester and Karuah river basins
The extent potentially exposed to reductions in annual flow (AF) is shown for the 5th, 50th and 95th percentiles. The reduction due to additional coal resource development is obtained by subtracting the results under the baseline from the results under the coal resource development pathway (CRDP).
Data: Bioregional Assessment Programme (Dataset 1)
The maximum change in annual flow due to additional coal resource development relative to the interannual variability of annual flow under the baseline is shown for each surface water model node in Figure 28. There are six model nodes where a reduction in annual flow is observed, and this change is less than the natural variability seen under the baseline. The small changes in annual flow due to the additional coal resource development are unlikely to cause a significant change in the interannual variability of annual flow compared to that under the baseline.
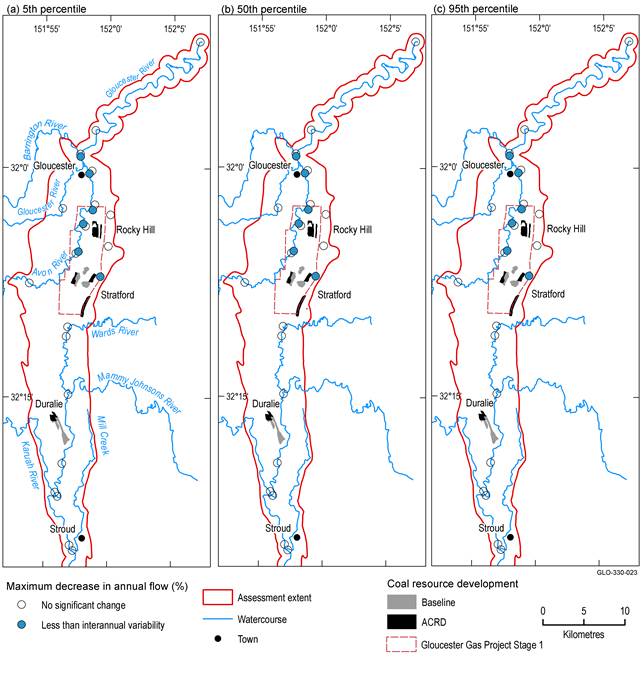
The extent of the mines in the CRDP is the union of the extents in the baseline and in the ACRD.
Data: Bioregional Assessment Programme (Dataset 1)
