Cumulative exceedance plot of the increase in the number of low-flow days (LFD) due to additional...
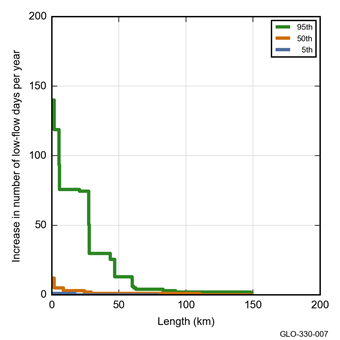
Figure 21 Cumulative exceedance plot of the increase in the number of low-flow days (LFD) due to additional coal resource development for 5th (blue), 50th (orange) and 95th (green) percentiles
Figure 21 Cumulative exceedance plot of the increase in the number of low-flow days (LFD) due to additional coal resource development for 5th (blue), 50th (orange) and 95th (green) percentiles
Cumulative exceedance plot of the increase in the number of low-flow days (LFD) due to additional...
Figure 21 Cumulative exceedance plot of the increase in the number of low-flow days (LFD) due to additional coal resource development for 5th (blue), 50th (orange) and 95th (green) percentiles
Data register
This page lists all of the datasets and subsets used by the figure shown within the product section or submethodology section named below.
The data links listed on this page connect to the relevant landing page on the information service data.gov.au. From this external site publically available datasets may be downloaded.
This information is provided to enable the identification, review and understanding of the datasets used in the bioregional assessments and their origins. This list of datasets enhances the transparency of the science by the Bioregional Assessments Programme.