3.5.2.1 Description
Of the 116 ecological assets in the Gloucester assessment extent, there are 17 ‘Surface water feature’ subgroup assets, 3 ‘Groundwater feature (subsurface)’ subgroup assets and 32 ‘Vegetation’ subgroup assets that are both water-dependent and in the zone of potential hydrological change (Table 26). The ‘Surface water feature’ subgroup includes catchments and the Karuah River estuary (which is not in the zone of potential hydrological change), and all assets are present in the database as polygons. The ‘Groundwater feature (subsurface)’ subgroup includes two alluvial aquifers and the New England Fold Belt, all of which are present in the database as polygons. The ‘Vegetation’ subgroup assets include the habitat (potential species distribution) of 14 EPBC Act-listed threatened ecological species and 1 threatened ecological community as polygons, 10-point assets of known platypus occurrence and 7 point assets at fish biodiversity hotspot monitoring locations.
Table 26 Classification of ecological assets in the assessment extent and zone of potential hydrological change
aAs reported in companion product 1.3 for the Gloucester subregion (McVicar et al., 2015), there was sufficient uncertainty about the groundwater dependence of GDE assets derived from the National atlas of groundwater dependent ecosystems (Bureau of Meteorology, 2012) to not analyse these further.
Data: Bioregional Assessment Programme (Dataset 1, Dataset 2)
3.5.2.2 ‘Surface water feature’ subgroup
All assets within this subgroup were classified as being in the ‘River or stream reach, tributary, anabranch or bend’ asset class; hence, the potential impacts on these assets are represented by impacts on the ‘Riverine’ landscape group. They consist of 17 Geofabric catchment polygons (Figure 49). The two numerically modelled landscape classes ‘Intermittent – gravel/cobble streams’ and ‘Perennial – gravel/cobble streams’ dominate the river length within this subgroup (Table 27). Based on the modelled hydrological and ecological impacts (Section 3.4.3.2 and Section 3.4.3.3), no discernible impact is expected on these assets although there is large uncertainty surrounding the ecological impacts on the riverine landscape classes.
Table 27 Length (km) of streams in landscape classes in the ‘Riverine’ landscape group within each asset in the ‘Surface water feature’ subgroup
Due to rounding, some totals may not correspond with the sum of the separate numbers.
Data: Bioregional Assessment Programme (Dataset 1, Dataset 2)
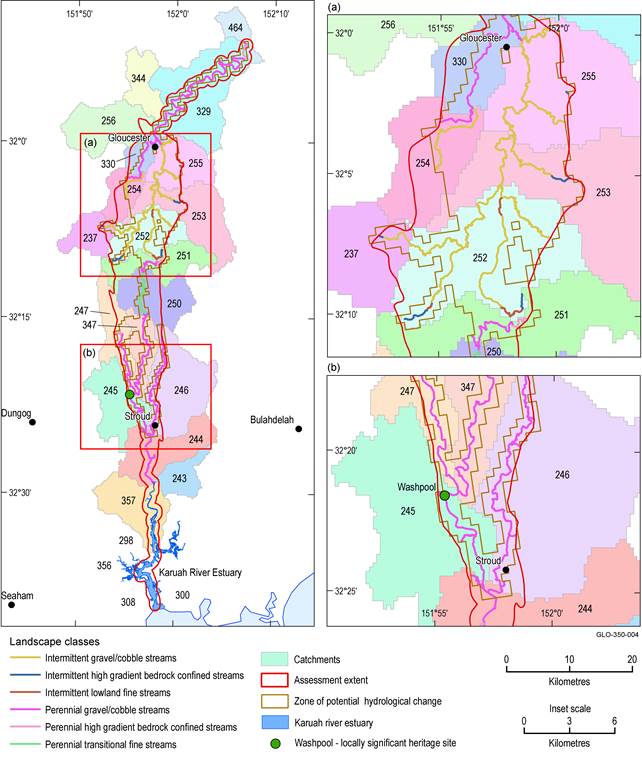
The Washpool (a sociocultural asset) is also shown.
Data: Bioregional Assessment Programme (Dataset 2, Dataset 3, Dataset 4)
3.5.2.3 ‘Groundwater feature (subsurface)’ subgroup
Assets within this subgroup are the Karuah Alluvium, Manning Alluvium and New England Fold Belt. No ecological landscape classes or models were developed to represent these assets. The reader is referred to Section 3.5.3 for a discussion of impacts on groundwater.
3.5.2.4 ‘Vegetation’ subgroup
The ‘Vegetation’ subgroup assets include the habitat (potential species distribution) of 14 EPBC Act-listed threatened ecological species and 1 threatened ecological community as polygons (Table 28), and 10 point assets of known platypus occurrence and 7 point assets at fish biodiversity hotspot monitoring locations. ‘Vegetation’ subgroup assets within the ‘Groundwater-dependent ecosystem’ asset class are represented by the ‘GDE’ landscape group and are discussed in Section 3.4. All other assets in this subgroup were classified as ‘Habitat (potential species distribution)’ assets.
Note that the terms ‘habitat’ and ‘potential species distribution’ are synonymous in relation to assets and that the potential species distributions or habitats do not necessarily imply that either the species or its habitat is present with the modelled distribution (see Section 2.3.3.1.3 of companion product 2.3 for the Gloucester subregion (Dawes et al., 2018)). The Department of the Environment and Energy Environmental Resources Information Network (ERIN) uses maximum entropy (MAXENT) modelling to define the geographic extent of potential species distributions based largely on physical parameters and past observations of the presence and absence of a species (Elith et al., 2011). The habitat itself, in the form of suitable vegetation types or ecosystems, is not necessarily present within the modelled potential species distribution. Furthermore, where suitable habitat does exist within the modelled potential species distribution, the species may not be known or predicted to occur based on NSW Office of Environment and Heritage species presence data and modelling (BioNet database; CSIRO, Dataset 5). As a result, not all species associated with ‘Habitat (potential species distribution)’ assets derived from ERIN are known or predicted to occur within the Gloucester assessment extent based on the BioNet database (Table 29), although this does not exclude the possibility that they may occur and have merely not been sighted. For example, the Australasian bittern, eastern bristlebird, red goshawk and Hastings River mouse are not known to occur within the Karuah-Manning subregion of the Hunter-Central Rivers Catchment Management Area, within which the Gloucester assessment extent lies.
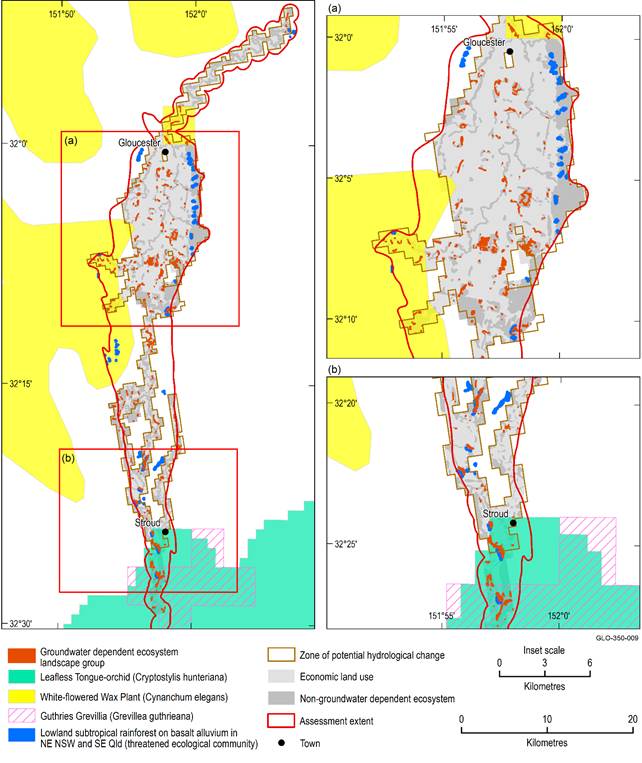
Furthermore, not all ‘Habitat (potential species distribution)’ assets are known to be associated with all GDE landscape classes (Table 29). For example, Guthrie’s grevillea is known to be associated with the ‘Wet sclerophyll forests’ landscape class but not with any of the other GDE landscape classes. Others, such as the grey-headed flying fox and spot-tailed quoll are associated with all the GDE landscape classes in the zone of potential hydrological change. The Australasian bittern is only known to be associated with landscape classes that lie outside the zone of potential hydrological change (‘Freshwater wetlands’ and ‘Saline wetlands’). The known associations of ‘Habitat (potential species distribution)’ assets with GDE landscape classes (Table 29), and the known or predicted occurrence of species associated with ‘Habitat (potential species distribution)’ assets within the assessment extent (Table 29), are based on information obtained from the NSW Office of Environment and Heritage BioNet database (CSIRO, Dataset 5).
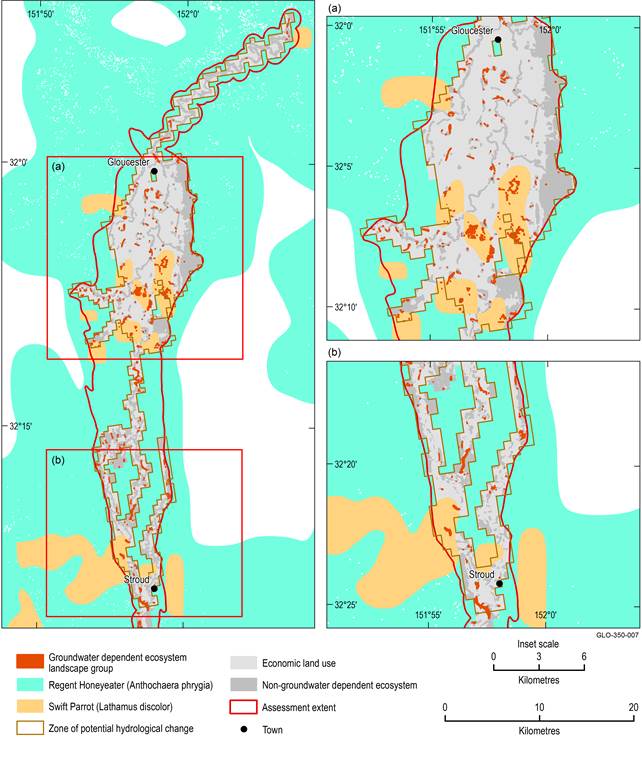
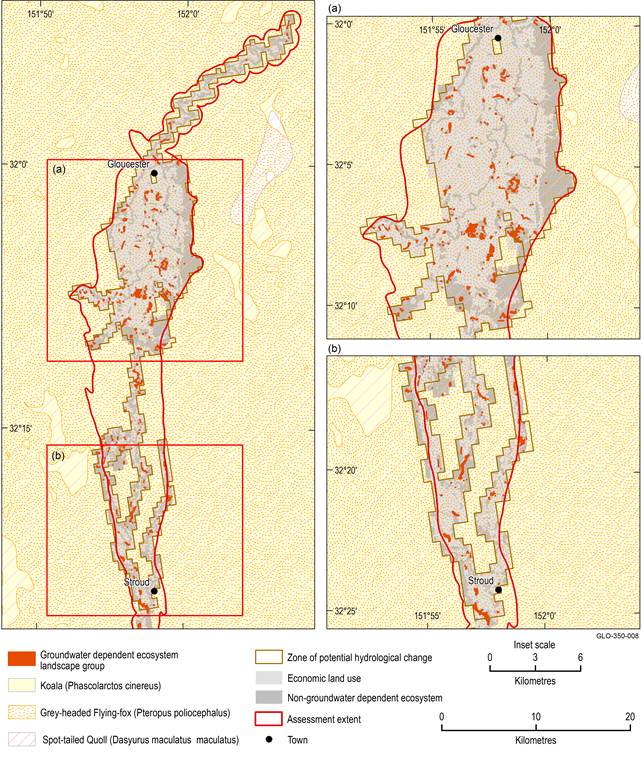
In the zone of potential hydrological change, the overwhelming majority of the polygon assets lay within landscape classes of the ‘Non-GDE’ and ‘Economic land use’ landscape groups. The area of assets classified as ‘Habitat (potential species distribution)’ assets within the ‘GDE’ landscape group ranged from as little as 6 ha for the ‘Lowland Subtropical Rainforest’ threatened ecological community to 407 ha for the grey-headed flying fox, koala, spot-tailed quoll, stuttering frog and regent honeyeater. Selected ‘Habitat (potential species distribution)’ assets are mapped in relation to the zone of potential hydrological change and GDE landscape classes in Figure 50 (plants and threatened ecological communities), Figure 51 (birds), Figure 52 (mammals) and Figure 53 (frogs, platypus and fish).
Table 28 Area (ha) of ‘Groundwater-dependent ecosystem (GDE)’, ‘Non-GDE’ and ‘Economic land use’ landscape groups within each habitat (potential species distribution) asset polygon, in the zone of potential hydrological change (zone)
An asterisk indicates species that are not known or predicted to be present within the Gloucester assessment extent.
TEC = threatened ecological community
Data: Bioregional Assessment Programme (Dataset 2)
Table 29 Area (ha) of landscape classes in the ‘Groundwater-dependent ecosystem (GDE)’ landscape group for each habitat (potential species distribution) asset, in the zone of potential hydrological change
An asterisk indicates species that are not known or predicted to be present within the Gloucester assessment extent. Bolded text indicates that the asset is known or predicted to be associated with that landscape class.
Data: Bioregional Assessment Programme (Dataset 2)
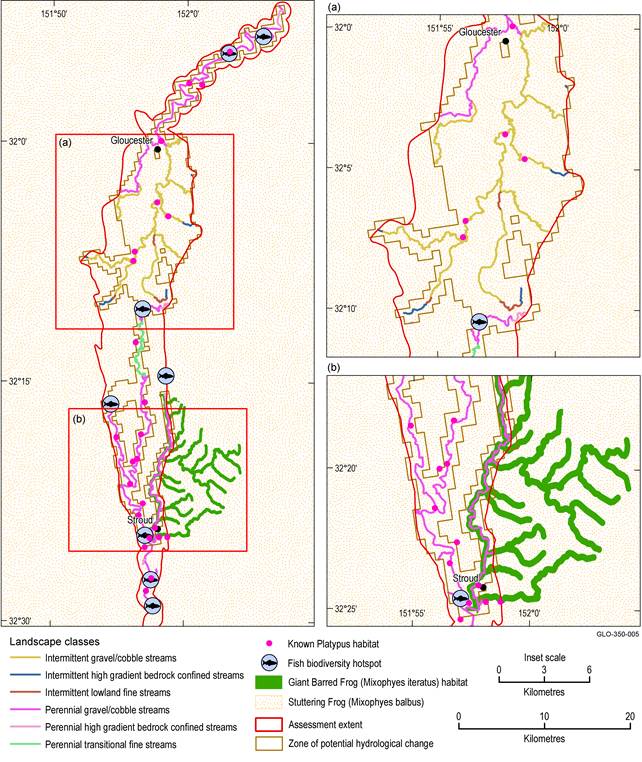
The assets associated with frog species were judged to be closely associated with two of the riverine landscape classes based on descriptions of their habitat and ecology (NSW Office of Environment and Heritage, 2016a, 2016b). The stuttering frog breeds in streams during summer after heavy rain. Its eggs are laid on rock shelves or shallow riffles in small, flowing streams. As the tadpoles grow they move to deep permanent pools and take approximately 12 months to metamorphose. Hence, the stuttering frog may be associated with the ‘Intermittent – gravel/cobble streams’ and ‘Intermittent – high gradient-bedrock confined-streams’ riverine landscape classes. There are 78 ha of the former class in the zone of potential hydrological change and the asset polygon for the stuttering frog, and 5 ha of the latter class. The giant barred frog is found along freshwater streams with permanent or semi-permanent water, generally (but not always) at lower elevation. Hence, the giant barred frog may occur in the ‘Perennial – gravel/cobble streams’, ‘Perennial – high-gradient bedrock-confined streams’ and ‘Perennial – transitional fine-streams’ riverine landscape classes. There are 25 km of the ‘Perennial – gravel/cobble streams’ landscape class in the zone of potential hydrological change and the asset polygon for the stuttering frog, and 2 km of the ‘Perennial – high-gradient bedrock-confined streams’ landscape class. The ‘Perennial – transitional fine-streams’ landscape class is not present in either the zone of potential hydrological change or the asset polygon for the giant barred frog. Based on modelled impacts of additional coal resource development on riverine landscape classes (Section 3.4.3.2 and Section 3.4.3.3), the habitat (potential species distribution) of the frog species are not expected to be impacted through their association with riverine landscape classes.
The platypus asset was judged to be associated with the ‘Perennial – gravel/cobble streams’, ‘Perennial – high-gradient bedrock-confined streams’ and ‘Perennial – transitional fine-streams’ landscape classes based on its known habitat and ecology (Grant, 1995). However, areas of potential platypus distribution were not provided owing to the point nature of the spatial data (Figure 53). Most known platypus locations are in the southern half of the Gloucester subregion. ‘Fish biodiversity hotspot’ monitoring sites are proxies for all fish species in the river systems and are assumed to be associated with all riverine landscape classes. Based on modelled impacts due to additional coal resource development on riverine landscape classes (Section 3.4.3.2 and Section 3.4.3.3), the platypus and fish species are not expected to be impacted through their association with riverine landscape classes.
Data: Bioregional Assessment Programme (Dataset 2, Dataset 3, Dataset 4)
Data: Bioregional Assessment Programme (Dataset 2, Dataset 3, Dataset 4)
Data: Bioregional Assessment Programme (Dataset 2, Dataset 3, Dataset 4)
Data: Bioregional Assessment Programme (Dataset 2, Dataset 3, Dataset 4)
The total area of habitat (potential species distribution) assets potentially impacted due to additional coal resource development based on the median estimate ranges from zero for the giant barred frog to over 70 ha for the regent honeyeater (Table 30). Generally, assets that have a wide modelled distribution, such as those associated with arboreal species, are more likely to be identified as potentially impacted; while assets with restricted modelled distributions are less likely to intersect areas identified as at risk of potentially large hydrological change. No GDEs associated with habitat (potential species distributions) are expected to experience more than a 1 m groundwater drawdown and most of the area is expected to experience a less than 0.5 m groundwater drawdown. 0.2 ha of the threatened ecological community, lowland subtropical rainforest, may experience more than a 1 m groundwater drawdown based on its association with the ‘Rainforests’ landscape class.
Based on the 5th and 95th percentile estimates of groundwater drawdown beneath the GDE landscape classes due to additional coal resource development, the total area of habitat (potential species distribution) assets potentially impacted ranged from zero for the giant barred frog (Table 30) to 186.2 ha for the regent honeyeater (Table 30). Based on the 5th percentile estimate, the impact is expected to be small with nearly all groundwater drawdown less than 0.2 m (Table 30). Based on the 95th percentile estimate, the impact is expected to be larger with several tens of hectares subjected to groundwater drawdown greater than 1 and 2 m (Table 30). It is very unlikely that any groundwater drawdown would exceed 5 m (Table 30). Based on the 95th percentile estimate less than 5 ha of threatened ecological community is expected to be subjected to groundwater drawdown.
The qualitative models (Section 3.4.4.3) predicted negative impacts of groundwater drawdown on populations of arboreal mammals, including koalas but not flying foxes, as well as nocturnal raptors and aggressive native honeyeaters. The impact of hydrological changes on flying foxes, regent honeyeaters, swift parrots and diurnal raptors is uncertain. Hence, the species in this group for which the hydrological impacts are largest (grey-headed flying fox, red goshawk, regent honeyeater, spot-tailed quoll) are also associated with some of the assets for which the potential impact of the hydrological changes is most uncertain. The qualitative model predicted negative impacts on koalas of groundwater drawdown and, in the 95th percentile case, 109 ha of habitat (potential species distribution) of the koala could potentially be impacted by groundwater drawdown, although only 55 ha of this is likely to experience greater than 0.5 m of drawdown. In the 50th percentile case, approximately 13 ha of habitat (potential species distribution) of the koala could potentially be impacted by groundwater drawdown greater than 0.5 m.
Table 30 Cumulative area (ha), in the zone of potential hydrological change, of all GDE landscape classes with which each potential species distribution asset is associated, and the degree to which they experience groundwater drawdown based on the 5th, 50th and 95th percentile modelling outputs
An asterisk indicates species that are not known or predicted to be present within the Gloucester assessment extent.
Data: Bioregional Assessment Programme (Dataset 2)
