This section describes the risks to landscape classes that are potentially impacted by hydrological changes arising in response to additional coal resource development. The focus is on landscape classes with potential ecological impacts. Impacts on economic assets are addressed in Section 3.5.
Landscape classification was used to characterise the diverse range of water-dependent assets into a smaller set of classes for further analysis. Landscape classes were organised into five landscape groups, which reflect their water-dependencies: ‘Riverine’, ‘Groundwater-dependent ecosystem (GDE)’, ‘Estuarine’, ‘Non-GDE’ and ‘Economic land use’ (Table 14). The basis for the landscape groups and classes is described in companion product 2.3 for the Gloucester subregion (Dawes et al., 2018). Landscapes classes that intersect the 250 km2 zone of potential hydrological change are considered potentially impacted due to additional coal resource development and are the focus of this section. Landscape classes that do not intersect the zone or are not water dependent can be ruled out as very unlikely to be impacted (less than 5% chance) due to additional coal resource development (see Section 3.4.2).
About 242 km (82%) of the 296 km of river length in the Gloucester assessment extent is in the zone of potential hydrological change (Table 14). Outside this zone are 51 km of perennial streams and 3 km of intermittent streams, mainly along the Karuah River in the south of the assessment extent (Figure 29). Most (87%) of the stream length in the zone comprises intermittent and perennial gravel/cobble streams (Table 14). Potential impacts on these two landscape classes are assessed using both qualitative models and quantitative receptor impact models developed for the Gloucester subregion (see companion product 2.7 for the Gloucester subregion (Hosack et al., 2018b)), with results presented in Section 3.4.3.
There is about 3.3 km2 of the ‘Groundwater-dependent ecosystem (GDE)’ landscape group in the zone of potential hydrological change (Table 14). Each of the five landscape classes in the ‘GDE’ landscape group is described by a qualitative model (companion product 2.7 for the Gloucester subregion (Hosack et al., 2018b)), which forms the basis for assessing the potential for impacts on the landscape class. Section 3.4.4 provides an assessment of the potential impacts on and risk to the landscape classes in the ‘Groundwater-dependent ecosystem (GDE)’ landscape group.
Receptor impact modelling converts the potentially abstract information about hydrological changes to quantities that stakeholders care about and can more readily understand and interpret. In particular, outcomes of the modelling will relate more closely to their ecological values and beliefs and therefore support community discussion and decision making about acceptable levels of coal resource development (companion submethodology M08 (as listed in Table 1) for receptor impact modelling (Hosack et al., 2018a)). Receptor impact models are not intended to make site-specific predictions but rather to quantify the range of possible responses of select receptor impact variables to a given change in hydrology. It is beyond the scope of a bioregional assessment (BA) to make precise predictions at exact locations.
Receptor impact variables represent biological components of the ecosystem that experts have chosen as indicators of ecosystem condition, and which are considered likely to be sensitive to changes in the hydrology of that system (see companion submethodology M08 (as listed in Table 1) for receptor impact modelling (Hosack et al., 2018a)). Changes in hydrology are represented in the model by hydrological response variables, chosen to reflect particular water requirements of the ecosystem. The magnitude of change in the chosen receptor impact variables to changes in one or more hydrological response variables, captured through an expert elicitation process, is an indicator of the magnitude of risk to the ecosystem as a result of hydrological perturbation. For example, a prediction that the number of riffle breeding frog species is likely to decrease in a particular reach where zero-flow days are predicted to increase does not necessarily mean that there are riffle breeding frogs present and that they will be impacted; rather, it means that given the magnitude of hydrological change predicted in that reach, there is a specific risk to the habitat requirements of riffle breeding frogs, and more generally a risk to the ecosystems represented by the landscape class the riffle breeding frog inhabits. The receptor impact modelling results are provided at a landscape scale and should not be interpreted as exactly representing the local conditions of a particular site.
Table 14 Extent of each landscape class in the assessment extent and the zone of potential hydrological change, and the landscape classes that have a qualitative model and/or a receptor impact model (RIM)
The extent of each landscape class is either an area of vegetation (km2) or length of stream network (km).
GDE = groundwater-dependent ecosystem
Data: Bioregional Assessment Programme (Dataset 1)
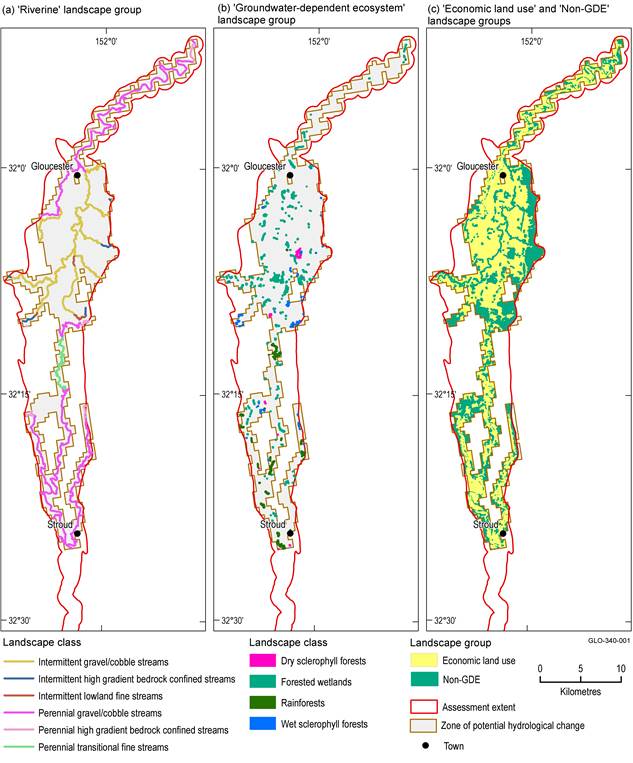
Figure 29 Landscape classes in the zone of potential hydrological change
Note that groundwater-dependent ecosystems (GDEs) are exaggerated (not to scale) for clarity.
Data: Bioregional Assessment Programme (Dataset 2, Dataset 3, Dataset 5); NSW Office of Water (Dataset 4); ABARES (Dataset 6)
