In assessing potential impacts on groundwater, changes are summarised by the hydrological response variable dmax – the maximum difference in drawdown, obtained by choosing the maximum of the time series of differences between two futures. Drawdowns are reported for a single regional watertable, which spans the alluvial, weathered rock and fractured rock units represented in the groundwater model.
In Figure 16, the panels show maximum predicted depth of drawdown due to the additional coal resource development for the 5th, 50th and 95th percentiles to illustrate the variation in model predictions due to parameter uncertainty. Additional drawdown occurs in two areas, the first area in the Gloucester river basin, centred on the Rocky Hill mine; the second in the Karuah river basin around the Duralie mine. Table 6 summarises the areas where the additional drawdown is greater than 0.2 m, greater than 2 m and greater than 5 m for the 5th, 50th and 95th percentiles in these two river basins and as a subregion total. For additional drawdown greater than 0.2 m, the area associated with the 5th percentile (19.7 km2) can be interpreted as representing the extent of drawdown when the model parameters reflect lower pumping rates and/or lower hydraulic conductivities. Conversely, the area of drawdown associated with the 95th percentile (100 km2) also includes the predictions based on higher pumping rates and relatively conductive geological layers. This is a general guide only as the influences of the different parameters can be complex and produce a range of drawdown responses. Groundwater drawdown predictions indicate that drawdowns of greater than 2 m are very likely (greater than 95% chance; 5th percentile) due to the additional coal resource developments at Duralie and around Rocky Hill (Figure 16a). Generally drawdowns exceeding 5 m due to the additional coal resource development are very unlikely, although the 95th percentile map indicates the possibility of >5 m drawdowns around the Rocky Hill development (Figure 16c).
The spatial distribution of drawdown under the baseline is shown in Figure 17, providing a visual comparison to the potential groundwater drawdown due to additional coal resource development in Figure 16. Under the baseline, the area with at least a 5% chance of drawdown greater than 0.2 m is about 140 km2. The areas of drawdown are associated with the baseline workings at the Duralie mine and the Stratford mine. The area of overlap with the groundwater zone is 53 km2 and represents the area where drawdowns due to baseline and additional coal resource developments potentially accumulate. Another 30 km2 overlaps with the surface water zone and defines the area where lagged groundwater drawdown responses from baseline developments could coincide with more instantaneous changes in streamflow due to the additional coal resource development. Table 7 summarises the area (km2) of baseline drawdown in the zone of potential hydrological change.
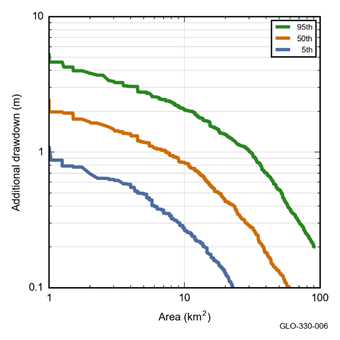
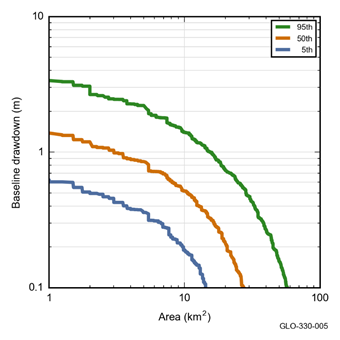
Figure 18 and Figure 19 summarise the modelled drawdowns due to the additional coal resource development and under the baseline as log-transformed cumulative exceedance plots by area for the 5th, 50th and 95th percentile drawdown distributions. The mine pit exclusion areas are not included here so the total area of drawdown is less than what is included in Table 6. It can be seen that there is a median probability of drawdown of at least 2 m due to the additional coal resource development over about 1.2 km2, but very unlikely to occur over an area exceeding 10 km2 outside the mine pit exclusion zone. Because the data are not classified, details within the classes can be discerned: drawdowns of at least 1 m due to baseline development have a median probability of occurring over about 3 km2 and due to additional coal resource development over about 8 km2; outside the mine pit exclusion zone, drawdowns greater than 5 m are very unlikely under the baseline and due to additional coal resource development.
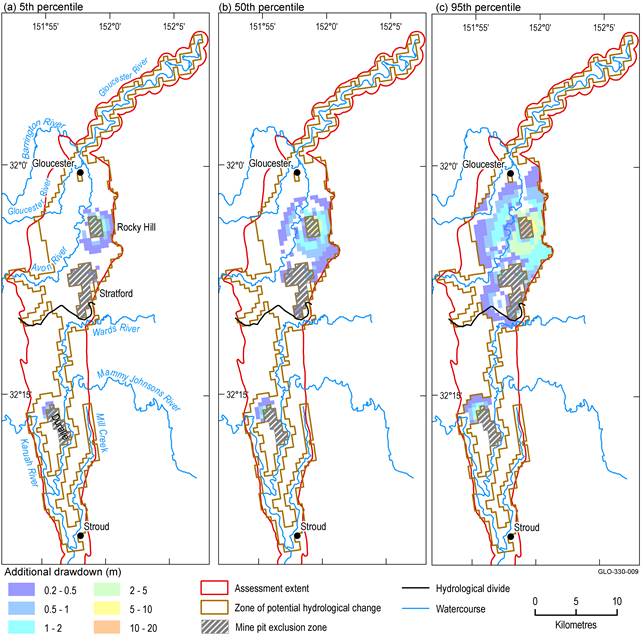
Figure 16 Additional drawdown (m) in the regional watertable (5th, 50th and 95th percentiles)
Additional drawdown is the maximum difference in drawdown (dmax) between the coal resource development pathway (CRDP) and baseline, due to additional coal resource development.
Data: Bioregional Assessment Programme (Dataset 1)
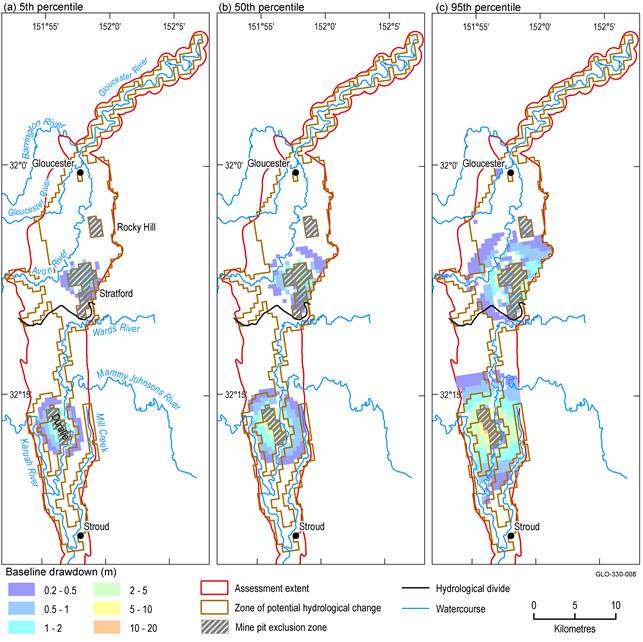
Figure 17 Baseline drawdown (m) in the regional watertable (5th, 50th and 95th percentiles)
Baseline drawdown is the maximum difference in drawdown (dmax) under the baseline relative to no coal resource development.
Data: Bioregional Assessment Programme (Dataset 1)
Data: Bioregional Assessment Programme (Dataset 1)
Data: Bioregional Assessment Programme (Dataset 1)
Table 6 Area (km2) potentially exposed to varying levels of drawdown due to additional coal resource development in the Gloucester and Karuah river basins
The area potentially exposed to ≥0.2, ≥2 and ≥5 m additional drawdown is shown for the 5th, 50th and 95th percentiles. Additional drawdown is the maximum difference in drawdown (dmax) due to additional coal resource development relative to the baseline.
Data: Bioregional Assessment Programme (Dataset 1)
Table 7 Area (km2) in the zone of potential hydrological change potentially exposed to varying levels of drawdown under the baseline in the Gloucester and Karuah river basins
The area potentially exposed to ≥0.2, ≥2 and ≥5 m of baseline drawdown is shown for the 5th, 50th and 95th percentiles. Baseline drawdown is the maximum difference in drawdown (dmax) under the baseline relative to no coal resource development.
Data: Bioregional Assessment Programme (Dataset 1)
