3.5.3.1 Assets in the zone of potential hydrological change
The water-dependent asset register for the Gloucester subregion (Bioregional Assessment Programme, Dataset 1) has 22 economic water-dependent assets, comprising 464 elements (Table 31). Economic elements include water source areas and monitoring bores, water access licences and basic water rights, represented spatially by groundwater production bores and surface water extraction points. The ‘unknown’ groundwater elements reflect the fact that the source data (NSW Office of Water, Dataset 6) did not specify the purpose for which the bore was used. The assets represent groupings of elements by water source and the purpose for which the right to water has been obtained.
In NSW, water resources in river and groundwater systems are managed through water sharing plans. These are subordinate legislation under NSW’s Water Management Act 2000. At the time that the asset register was compiled, the water sharing plans relevant to the Gloucester subregion were the Water Sharing Plan for the Karuah River Water Source and the Water Sharing Plan for the Lower North Coast Unregulated and Alluvial Water Sources. In July 2016, NSW Department of Primary Industries Water merged the Karuah River plan into the Water Sharing Plan for the Lower North Coast Unregulated and Alluvial Water Sources. At the same time, the Water Sharing Plan for the North Coast Fractured and Porous Rock Groundwater Sources commenced, which covers the entire Gloucester subregion. This water sharing plan was in draft form when the assets register was compiled, but is considered in the following assessment of impacts on economic assets. Each water sharing plan specifies the water sources to which it applies. There are differences between the groundwater sources specified under the Water Sharing Plan for the North Coast Fractured and Porous Rock Groundwater Sources and the groundwater management units used to group elements into assets in the water-dependent assets register for the Gloucester subregion (see companion product 1.3 (McVicar et al., 2015)).
Within the Gloucester subregion zone of potential hydrological change, there are 22 economic assets, comprising 370 elements (Table 31). Thus, all surface water and groundwater economic assets in the water-dependent asset register are potentially impacted due to additional coal resource development, although not all of the elements comprising the assets are. The final column in Table 31 identifies groundwater and surface water elements in the mine pit exclusion zone. There are 35 groundwater bores in the mine pit exclusion zone. While these 35 bores are clearly within the zone of potential hydrological change and hence potentially impacted due to additional coal resource development, the modelled estimates of drawdown in the vicinity of open-cut pits are highly uncertain. In the Gloucester subregion, it is assumed that there are no significant deep, high yielding aquifers, which would necessitate consideration of different drawdown zones at depth, thus economic assets that are outside the zone, as defined in Section 3.3.1, are considered very unlikely to be impacted due to additional coal resource development.
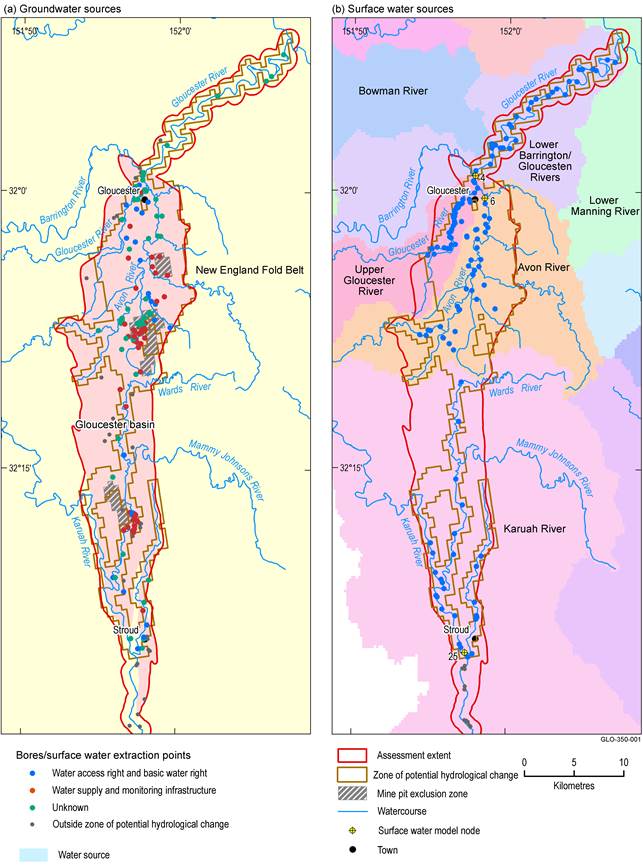
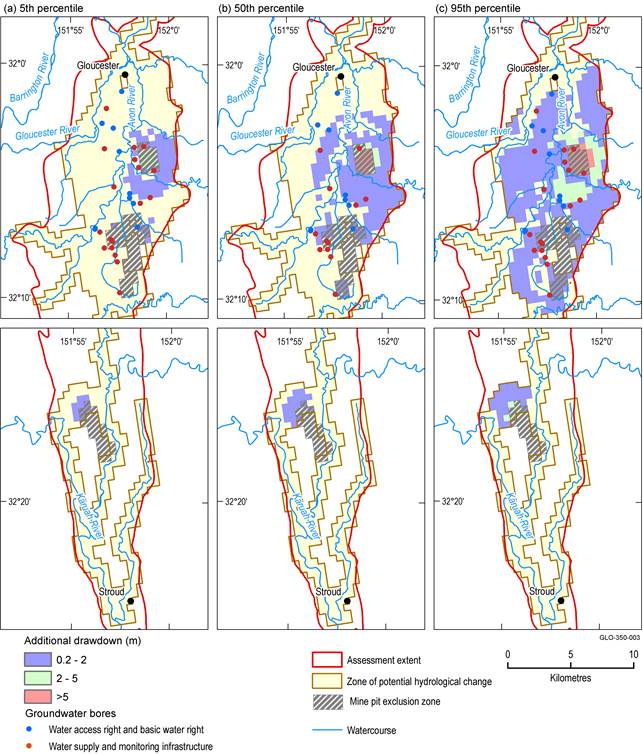
Figure 54 identifies (i) the groundwater sources and bores and (ii) the surface water sources and extraction points that intersect the zone of potential hydrological change, and hence are potentially impacted due to additional coal resource development. Table 32 lists the potentially impacted groundwater and surface water sources and the number of water rights holders (both access licence and basic rights), monitoring bores and ‘unknown’ bores by water source in the zone of potential hydrological change. Of the 370 elements in the zone of potential hydrological change (Table 31), 339 relate to bores (159) and surface water extraction points (180). There are no bores or extraction points within the Lower Manning River water source in the zone of potential hydrological change. Figure 54b shows that the intersection of this water source with the zone of potential hydrological change is marginal, and probably an artefact of the assessment unit scale, and hence can be ruled out as potentially impacted due to additional coal resource development. Thus, seven groundwater and surface water sources are potentially impacted due to additional coal resource development.
Table 31 Economic assets and elements in the Gloucester assessment extent, zone of potential hydrological change and mine pit exclusion zone
aUnknown elements are bores for which the purpose was not specified in the source data.
Data: Bioregional Assessment Programme (Dataset 1, Dataset 7)
Most of the bores in the zone of potential hydrological change in the Gloucester Basin groundwater source are classed as ‘unknown’ purpose or monitoring bores. The Avon River, Upper Gloucester River, Karuah River and Lower Manning River water sources, which include the water in the unregulated rivers and their associated alluvial aquifers, have the greatest number of water users.
Data: Bioregional Assessment Programme (Dataset 1, Dataset 4)
Table 32 Water source areas and associated extraction and monitoring points in the zone of potential hydrological change
aIntersection of Lower Manning River water source with zone of potential hydrological change is negligible and this water source is unlikely to be impacted by additional coal resource development.
bOf the 370 elements in the zone of potential hydrological change (Table 31), 339 relate to water access rights and monitoring infrastructure.
Data: Bioregional Assessment Programme (Dataset 7)
The 159 groundwater bores identified in Table 31 as being in the zone of potential hydrological change include 49 bores that are in the groundwater zone of potential hydrological change and 110 bores solely in the surface water zone of potential hydrological change. Of the latter 110 bores, only those extracting from an alluvial aquifer could potentially be impacted. This relates to the high connectivity of alluvial aquifers to water in the streams and means alluvial bores could be impacted by changes in baseflow due to additional coal resource development, even though they are outside the area of drawdown used to define the groundwater zone of potential hydrological change (Section 3.3.1.1). In NSW, these highly connected water sources are managed conjunctively. In the Gloucester subregion, alluvium thickness has been reported as averaging about 9 m in the Duralie Coal Mine area (Heritage Computing, 2009) and up to 15 m in the Avon river basin (Parsons Brinckerhoff, 2015). Thus, bores in the surface water zone of potential hydrological change with a drill depth exceeding 15 m can be ruled out as very unlikely to be impacted due to additional coal resource development.
Figure 55 shows the bores with depths greater than or less than 15 m, as well as bores for which depth information was not available, and this is summarised in Table 33 along with bore purpose. There are 35 bores that can be ruled out as unlikely to be impacted (they are not in the drawdown area and not in the alluvium) and another 35 that are potentially impacted (they are in the alluvium but could be affected by baseflow). The 40 bores with no drill depth information cannot be ruled out. This means there is a total of 75 potentially impacted bores in the surface water zone of potential hydrological change.
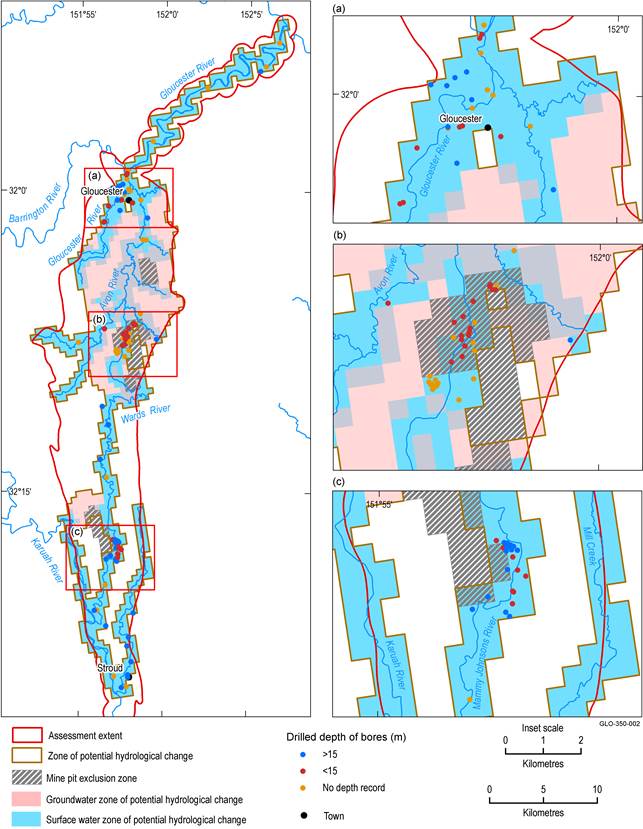
Figure 55 Groundwater bores in surface water zone of potential hydrological change by depth class
Data: Bioregional Assessment Programme (Dataset 1, Dataset 4, Dataset 7)
Table 33 Drill depths and purpose of potentially impacted bores solely in surface water zone of potential hydrological change (surface water zone)
|
Bores solely in surface water zone |
Number with depth >15 m |
Number with depth <15 m |
Number with no depth |
||||||
|
Mon |
Prod |
Unk |
Mon |
Prod |
Unk |
Mon |
Prod |
Unk |
|
|
110 |
11 |
17 |
7 |
14 |
3 |
18 |
14 |
2 |
24 |
Mon = monitoring, Prod = production (water access licence and basic water rights), Unk = unknown purpose
Data: Bioregional Assessment Programme (Dataset 7)
In summary, five surface water sources and two groundwater sources are potentially impacted by hydrological changes due to additional coal resource development. Figure 56 summarises the rule-out process for the 339 bores and surface water extraction points in the zone. There are 304 which are potentially impacted due to additional coal resource development (35 bores are accessing deeper, fractured rock where impacts were not assessed). However, changes in hydrology are not considered to result in an economic impact at monitoring sites, so 58 monitoring bores can be ruled out as unlikely to be impacted. Thus, there is a potential for economic impacts due to additional coal resource development at 246 bores and surface water extraction points in the zone of potential hydrological change. This number includes points where the purpose of the bore is unknown.
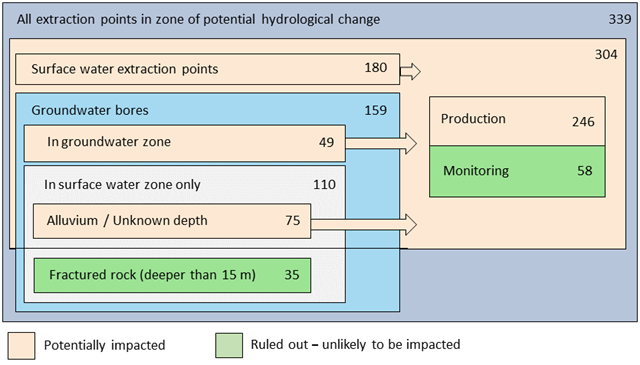
Data: Bioregional Assessment Programme (Dataset 1, Dataset 7)
To determine whether the predicted hydrological changes due to additional coal resource development are likely to impact water rights holders, an assessment is made of changes in water availability and reliability of flows in the potentially impacted unregulated and alluvial water source areas. Groundwater production bores, located in areas where modelled drawdowns exceed minimal impact consideration thresholds, are identified as at risk of an economic impact. These three indicators of impact are considered in the following sections.
3.5.3.2 Potential impacts on surface water assets
To assess the potential impacts due to additional coal resource development on water availability in water sources of the Gloucester subregion, the change in mean annual flow at the most downstream model node in each water source is used. It is calculated as the difference in mean annual flow in each 30-year block between the CRDP and baseline and provides an indication of the potential change in water availability. Results are presented in Table 34 for the most downstream model node of the three water sources in the Lower North Coast Unregulated and Alluvial Water Sources plan area where the surface water modelling indicated a change in annual flow (AF) exceeding the chosen threshold. The average annual water availability under the baseline over the simulated 90-year period is included to show the variability in water availability, predominantly due to climate variability as well as to put the changes into context. In absolute terms, the biggest reductions in annual flows occur in the Upper Gloucester River (~0.86%) and Avon River (~1.83%) water sources (95th percentile of ~1.58 GL/year) between 2013 and 2042. Changes to water availability in the Karuah River water source are negligible (<0.11%), with the largest potential decrease in mean annual flow of 0.05 GL/year (95th percentile) occurring between 2073 and 2102.
Table 34 Change in water availability due to additional coal resource development (ACRD)
Average annual flow for 2013–2102 under the baseline is provided to show variability due to climate.
aWater sources included are those where the surface water modelling showed a change in the annual flow (AF) hydrological response variable at the specified node exceeding the given threshold (see companion product 2.6.1 for the Gloucester subregion (Zhang et al., 2018)).
The change in water availability is shown for the 5th, 50th and 95th percentile estimates.
Data: Bioregional Assessment Programme (Dataset 8)
To ensure that sufficient water is retained in unregulated rivers to meet environmental requirements, NSW water sharing plans often specify rules governing extractions. These cease-to-pump rules specify the river level/flow rate below which extractions from an alluvial water source, including the stream, are not permitted. In some water sources, these rules still attach to an individual licence holder’s licence conditions, but the general trend is towards defining extraction rules by water source within water sharing plans. Cease-to-pump rules are defined with regard to all current water licence entitlements accessing either surface water or groundwater (in highly connected alluvial aquifers) – that is, rules assume full development rather than actual take.
Table 35 summarises the cease-to-pump rules for water sources in the zone of potential hydrological change where surface water modelling results also showed a change in the low-flow days (LFD) hydrological response variable exceeding the given threshold, defined in companion submethodology M06 (as listed in Table 1) for surface water modelling (Viney, 2016). The Karuah River water source is divided into two management zones, the Karuah estuarine management zone and Karuah upriver management zone, and different cease-to-pump rules apply in each management zone. Modelling results indicate that the Karuah estuarine management zone is not in the zone of potential hydrological change.
Table 35 Access rules for cease-to-pump for water sources in the surface water zone of potential hydrological change where there is a change in low-flow days due to additional coal resource development
The cease-to-pump rules indicate that differences in the number of zero-flow or low-flow days between the CRDP and baseline can be used to quantify the impact on pumping days due to additional coal resource development. Table 36 summarises the change in the number of cease-to-pump days due to additional coal resource development at model nodes (shown in Figure 54b) where there was a change in LFD exceeding the given threshold. Where cease-to-pump is triggered by ‘no visible flow’, the difference in the mean annual number of zero-flow days between the CRDP and baseline for each 30-year period is used to quantify the impact. Where cease-to-pump is based on the flow rate falling below a specified flow rate at a reference location, then the change is assessed using that flow threshold – that is, calculated as the difference in the mean annual number of days when flow is below the cease-to-pump flow rate threshold between the CRDP and baseline for each 30-year period. Due to technical issues in modelling zero flows, the change in the number of days of flows below 1 ML/day at model node 6 (shown in Figure 54b) has been used for the Avon River water source to assess the potential impact on cease-to-pump days in this water source. Table 36 includes the average number of cease-to-pump days under baseline over the analysis period (2013 to 2102), which provides an indication of the variability in cease-to-pump days as a result of climate variability.
Under the baseline for the 2013 to 2102 period, the surface water modelling results indicate there is a 5% chance that cease-to-pump days in the Karuah River (upriver management zone) and the Upper Gloucester water sources could exceed 50 days/year and 35 days/year, respectively. For the Avon River water source, there is a 5% chance of 80 or more days of flows below 1 ML/day, which is not the cease-to-pump threshold, but an indicator of the low-flow regime for the 90-year climate sequence modelled. In at least 50% of years in both water sources, there are unlikely to be any cease-to-pump days in the Karuah River or Upper Gloucester River water sources, but the Avon River can expect some low-flow days, although not necessarily cease-to-pump days. The impact on cease-to-pump days due to additional coal resource development in the Karuah River and Upper Gloucester River water sources is insignificant, with even the 95th percentile change being less than one day. In the Avon River, there is a 95% chance that the increase in days with flow <1 ML/day will be fewer than three in all three 30-year periods.
Table 36 Increase in cease-to-pump days due to additional coal resource development (ACRD) in water sources in the zone of potential hydrological change
aWater sources included are those where the surface water modelling showed a change in the low-flow days (LFD) hydrological response variable exceeding the given threshold at the specified node (see companion product 2.6.1 for the Gloucester subregion (Zhang et al., 2018)).
The increase in cease-to-pump days is shown for the 5th, 50th and 95th percentile estimates.
Data: Bioregional Assessment Programme (Dataset 8)
3.5.3.3 Potential impacts on groundwater assets
Environmental provisions relating to extractions from aquifers are intended to protect the long-term storage component of the aquifer. Extractions are based on reserving a proportion of recharge for the environment. Cease-to-pump rules are used to restrict pumping when levels drop below some specified level or water quality is deteriorating. The NSW Aquifer Interference Policy (NSW Department of Primary Industries, 2012), which was introduced in September 2012, is intended to protect groundwater resources from activities that potentially interfere with them. It requires that all water extracted from an aquifer must be accounted for, that the activity must address minimal impact considerations and planning must make provision for situations where actual impacts are greater than predicted.
Minimal impact thresholds are specified for highly productive and less productive groundwater sources and different aquifer types (alluvial, coastal sands, porous rock and fractured rock), but can generally be defined as <10% cumulative variation in watertable level, 40 m from any high-priority GDE or culturally significant site, with a maximum decline of 2 m at any water supply work. Make good provisions could apply, unless it can be demonstrated to the Minister’s satisfaction that the interference will not prevent the long-term viability of the GDE or culturally significant site, or impact a licensed water holder’s access to their entitlement. For groundwater quality, minimal impacts are defined as no lowering of the beneficial-use category of the groundwater source beyond 40 m from the activity and a <1% increase in groundwater salinity in a highly connected surface water source at the nearest point to the activity.
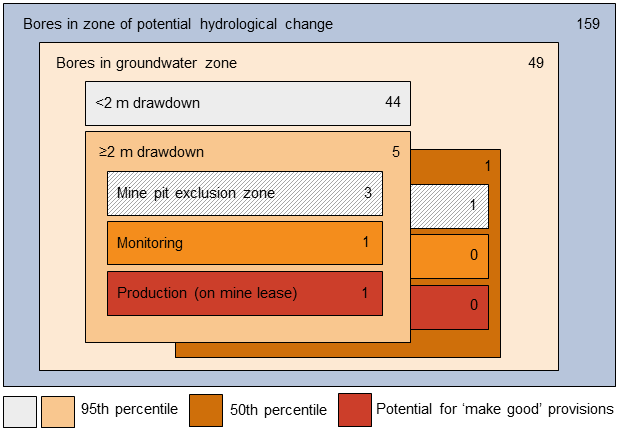
As previously stated, there are 49 groundwater bores in the groundwater zone of potential hydrologic change. Of these, five have at least a 5% chance of experiencing a drawdown greater than 2 m due to additional coal resource development (Table 37). Three of these, including one production bore, are in the mine pit exclusion zone and might be, or have been, removed in the process of mine pit excavation. One is a monitoring bore and groundwater drawdown of any magnitude is unlikely to result in an economic impact. One is a production bore, where an economic impact might result if the licence holder’s access to groundwater under their entitlement is affected. This bore is owned by AGL and therefore not likely to result in an impact that would require AGL to compensate another party (Figure 57). However, if the additional coal resource development at Rocky Hill is the cause of drawdown, then Rocky Hill might be required to compensate AGL or other affected license holder. The relative contributions to drawdown from each development were not modelled.
Using the 50% percentile to define the ‘more at risk’ bores, there are no bores outside the mine pit exclusion zone identified as more at risk. Figure 57 provides a graphical summary of the number of bores in the zone and those where regional scale modelled drawdowns exceed the minimal impact consideration threshold based on 95th and 50th percentile results. The locations of these bores are shown in Figure 58.
Table 37 Number of bores where maximum drawdown due to additional coal resource development (ACRD) is predicted to be greater than 2 m
aProduction bores are associated with a water access licence or basic water right.
bMonitoring bores are part of the ‘Water supply and monitoring infrastructure’ asset class.
The number of bores where maximum drawdown due to ACRD is predicted to be greater than 2 m is shown for the 5th, 50th and 95th percentile estimates.
ACRD = additional coal resource development
Data: Bioregional Assessment Programme (Dataset 7)
Data: Bioregional Assessment Programme (Dataset 7)
Data: Bioregional Assessment Programme (Dataset 1, Dataset 4, Dataset 7)
