3.4.3.1 Description
Hydrological regimes for the Gloucester assessment extent are discussed in more detail in companion product 1.1 (McVicar et al., 2014) and companion product 2.1-2.2 (Frery et al., 2018) for the Gloucester subregion and only a brief summary is presented here for context. The Gloucester Basin is separated into a northern sub-basin (where regional groundwater flow is predominantly from south to north) and a southern sub-basin (where regional groundwater flow is predominantly from north to south). There is no surface water connection between the northern and southern river basins, nor is there evidence of a substantial groundwater connection between them.
Stream and aquifer salinity indicate that streams within the assessment extent are generally gaining. Thus, groundwater is an important source of baseflow in this landscape group (companion product 1.1 for the Gloucester subregion (McVicar et al., 2014)). Groundwater recharge has been variously estimated as being between 0% and 17% (steady-state conditions) and between 0% and 28% (transient conditions) of rainfall, with high values associated with alluvial aquifers (Australasian Groundwater and Environmental, 2013; Heritage Computing, 2009, 2012; Parsons Brinckerhoff, 2013). Discharge occurs from all the hydrogeological units to rivers and streams and, as evapotranspiration by deep-rooted vegetation, from the shallow watertable. Groundwater salinity increases with depth, although typically, groundwater associated with alluvial aquifers varies from fresh to brackish (electrical conductivity (EC) of 387–5810 µS/cm; companion product 1.1 for the Gloucester subregion (McVicar et al., 2014)). Companion product 2.1-2.2 for the Gloucester subregion (Frery et al., 2018) reported that groundwater depths in the alluvium ranged from very near the surface to 13.4 m below ground level. Almost no data were available outside the alluvium; however, modelled depths to watertable (Summerell and Mitchell, 2011) suggest that groundwater is no deeper than 12 to 16 m in any of the lowland areas of the assessment extent (Figure 30).
The two closely related landscape classes, ‘Perennial – gravel/cobble streams’ and ‘Intermittent – gravel/cobble streams’, dominate potentially impacted stream reaches in the ‘Riverine’ landscape group (Table 14). The ‘Perennial – gravel/cobble streams’ landscape class represents 52% of the stream network within the non-estuarine region of the assessment extent (Dawes et al., 2018). In the northern half of the assessment extent, the landscape class is mainly restricted to the Gloucester River; in the southern half of the assessment extent it also occurs along the Karuah and Mammy Johnsons rivers. The ‘Intermittent – gravel/cobble streams’ landscape class occupies 20% of the stream network within the non-estuarine region of the assessment extent, with the majority occurring in the northern half of the assessment extent (companion product 2.3 for the Gloucester subregion (Dawes et al., 2018)). The Avon River (which is a major tributary of the Gloucester River) and its tributaries dominate this landscape class. The Avon river basin area occupies approximately 73% of the northern-flowing part of the assessment extent, and descends 412 m over its 42 km course (companion product 1.1 for the Gloucester subregion (McVicar et al., 2014)).
Pools and riffles are most common in streams with mixed bed materials ranging from 2 to 256 mm in size (Knighton, 1984); hence, they are a feature of the ‘Perennial – gravel/cobble streams’ and ‘Intermittent – gravel/cobble streams’ landscape classes. The mixed substrate forms alternating pool and riffle sequences that increase the geomorphic and habitat complexity along the reach (Boulton et al., 2014). Riparian vegetation lining the banks of the landscape classes in the ‘Riverine’ landscape group provides important in-stream and terrestrial habitats and contributes to geomorphic condition by maintaining bank stability (Boulton et al., 2014). This riparian vegetation is dominated by forested wetlands, typically characterised by a eucalypt-dominant overstorey and a grassy or shrubby understorey, although actual species composition is highly variable (Keith, 2004). The Karuah River from Stroud to Karuah is relatively well vegetated, but much of the riparian zone is cleared along the Avon and Gloucester rivers (see Section 1.1.7.2 of companion product 1.1 for the Gloucester subregion (McVicar et al., 2014)) and much of the riparian zone outside of the Karuah National Park and reserves is in poor condition (Haine et al., 2012). Patches of rainforest, including the ‘Lowland Rainforest of Subtropical Australia’ threatened ecological community, are largely restricted to reaches along the Karuah River (see Section 2.3.3.1 of companion product 2.3 for the Gloucester subregion (Dawes et al., 2018)).
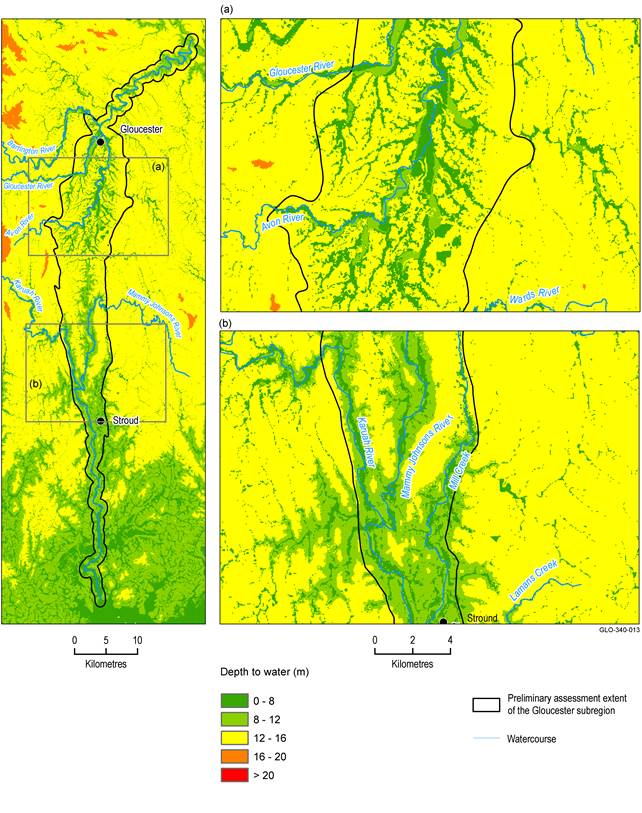
Figure 30 Modelled depth to watertable
Data: NSW Department of Primary Industries (Dataset 7)
Only 3% of the perennial streams and 2% of the intermittent streams in the zone of potential hydrological change were classed as good geomorphic condition (Figure 31). Chessman et al. (2006) observed that reaches of the Bega River in good geomorphic condition were important for maintaining native biodiversity and were biologically very different from stream reaches in moderate or poor condition. Deterioration from moderate to poor geomorphic condition resulted in less biological change than the deterioration from good to moderate. Of the intermittent streams in the zone, 51% were in moderate condition and 46% were in poor condition. Of the perennial streams in the zone, 83% were in moderate condition and 15% were in poor condition. The relatively poor geomorphic condition of the intermittent streams was reflected in riparian cover: 59% of the intermittent river reaches in the zone had some vegetation cover, while 88% of the perennial river reaches had some vegetation cover (Figure 32). Riparian vegetation (Figure 32) along both perennial and intermittent streams is dominated by ‘Forested wetlands’ and ‘Rainforest’ landscape classes.
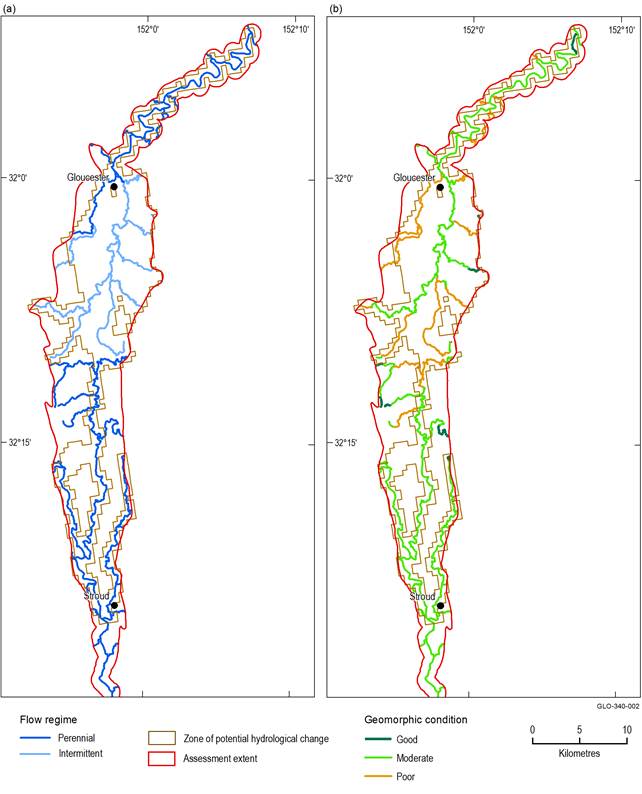
Figure 31 (a) Flow regime and (b) geomorphic condition of perennial and intermittent streams
Data: Bioregional Assessment Programme (Dataset 2, Dataset 3, Dataset 5)
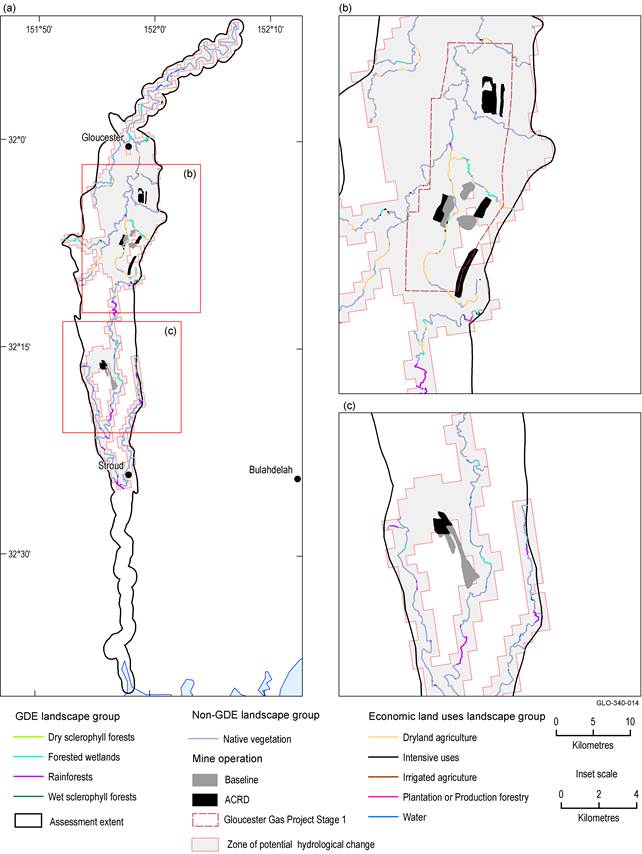
ACRD = additional coal resource development, CSG = coal seam gas, GDE = groundwater-dependent ecosystem
Data: Bioregional Assessment Programme (Dataset 2, Dataset 3, Dataset 8, Dataset 9); NSW Office of Water (Dataset 4); ABARES (Dataset 6)
The ‘Riverine’ landscape group supports a range of native and introduced fish species. Native species that migrate upstream and downstream may be important indicators of longitudinal connectivity (Koehn and Crook, 2013). Examples include the diadromous (migrates between fresh and estuarine waters) Australian bass (Macquaria novemaculeata) and striped gudgeon (Gobiomorphus australis), and the potamodromous (migrates wholly within fresh waters) Cox’s gudgeon (Gobiomorphus coxii). Changes to flow regimes or water quality may impact the life cycles of these fish by (NSW Department of Primary Industries, 2006):
- interrupting spawning or seasonal migrations
- restricting access to preferred habitat and available food resources
- reducing genetic flow between populations
- increasing susceptibility to predation and disease through accumulations of fish below barriers
- fragmenting previously continuous communities
- disrupting downstream movement of adults and impeding larval drift through the creation of still-water (lentic) environments.
Other native fish species reported from NSW DPI Fisheries monitoring (NSW Department of Primary Industries, Dataset 10) of the Gloucester, Karuah, Wards and Mammy Johnsons rivers include Australian smelt (Retropinna semoni), bullrout (Notesthes robusta), common jollytail (Galaxias maculatus), dwarf flat-headed gudgeon (Philypnodon macrostomus), empire gudgeon (Hypseleotris compressa), firetail gudgeon (Hypseleotris galii), flat-headed gudgeon (Philypnodon grandiceps), eel-tailed catfish (Tandanus tandanus), freshwater herring (Potamalosa richmondia), freshwater mullet (Myxus petardi), long-finned eel (Anguilla reinhardtii), sea mullet (Mugil cephalus), short-finned eel (Anguilla australis), southern blue-eye (Pseudomugil signifer) and yellowfin bream (Acanthopagrus australis). Exotic fish species have also been observed (e.g. eastern gambusia and goldfish).
Qualitative and quantitative mathematical models for the ‘Intermittent – gravel/cobble streams’ and ‘Perennial – gravel/cobble streams’ landscape classes are presented in Section 2.7.3 of companion product 2.7 for the Gloucester subregion (Hosack et al., 2018b).
3.4.3.2 Potential hydrological change
3.4.3.2.1 ‘Perennial – gravel/cobble streams’ landscape class
The hydrological factors identified by experts in the qualitative modelling workshops (see companion product 2.7 for the Gloucester subregion (Hosack et al., 2018b) have been interpreted as a set of hydrological response variables. The groundwater hydrological factors and associated hydrological response variables for the ‘Perennial – gravel/cobble streams’ landscape class are the:
- maximum difference in drawdown under the baseline future or under the coal resource development pathway future relative to the reference period (1983 to 2012) (dmaxRef)
- year that the maximum decrease of groundwater occurs (tmaxRef).
The surface water hydrological factors and associated hydrological response variables for the ‘Perennial gravel/cobble streams’ landscape class are the:
- mean annual number of events with a peak daily flow exceeding the volume of flow that is assumed to result in ‘overbench’ flow (EventsR0.3)
- mean annual number of events with a peak daily flow exceeding the volume of flow that is assumed to result in ‘overbank’ flow (EventsR3.0)
- number of zero-flow days per year, averaged over a 30-year period (ZQD, subsequently referred to in this Section as ‘zero-flow days’)
- ratio of total baseflow generation to total streamflow generation, averaged over a 30-year period (QBFI).
For details of these variables the reader is referred to Section 2.7.3 of companion product 2.7 for the Gloucester subregion (Hosack et al., 2018b).
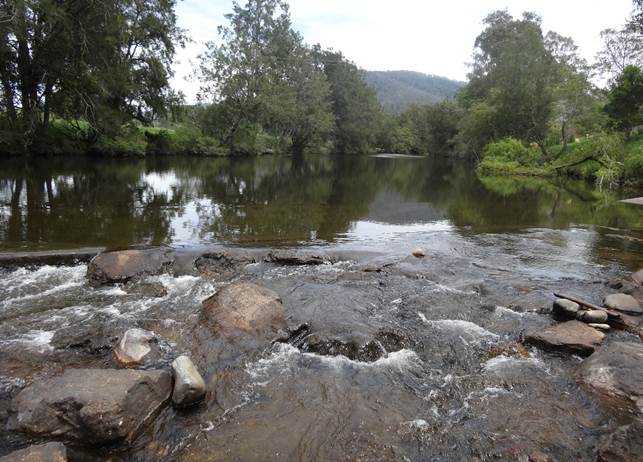
Figure 33 Perennial gravel/cobble stream in the Gloucester subregion
Source: Heinz Buettikofer, CSIRO
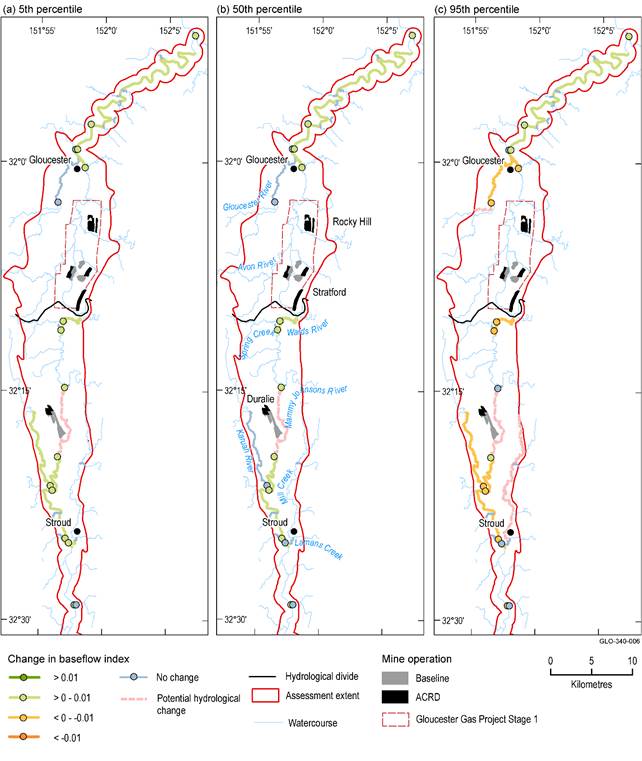
The total length of perennial gravel/cobble streams in the zone of potential hydrological change is 133 km. Modelling results indicate that there is a 95% chance that the length of perennial gravel/cobble stream subjected to a drawdown of greater than 0.2 m due to additional coal resource development will be less than 1.8 km (Table 15). Hence, it is very unlikely that the length of perennial gravel/cobble streams subject to a drawdown of greater than 0.2 m will exceed 1.8 km. The median estimate is that no stream length will be subject to a drawdown of greater than 0.2 m due to additional coal resource development (Table 15). This is consistent with the remoteness of perennial gravel/cobble streams from additional coal resource development (Figure 34).
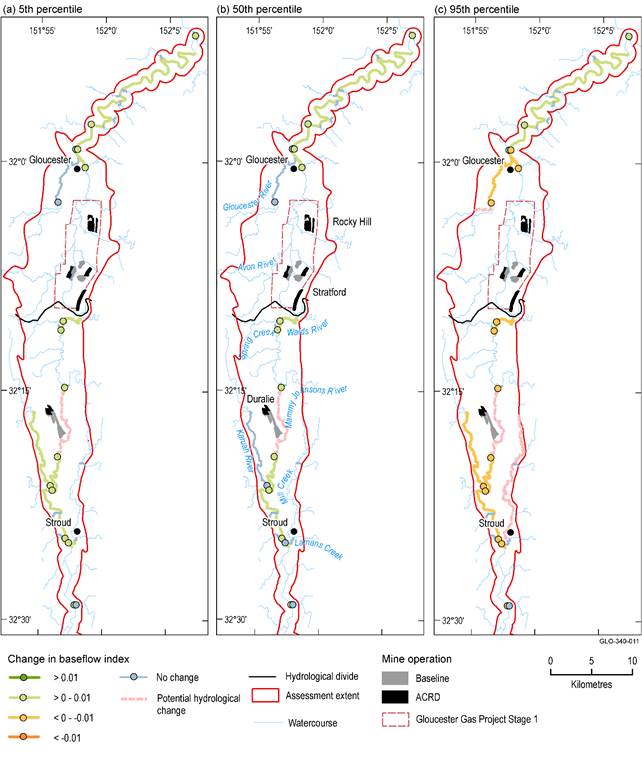
Based on the median estimates, it is likely that there will be little change in baseflow index resulting from additional coal resource development. The median estimate of stream length with no change resulting from additional coal resource development is 34.7 km in the 30-year periods preceding both 2042 (Figure 34) and 2102 (Figure 35, Table 16). A further 59.8 km of stream length is predicted to have a very small (<0.01) increase in baseflow index, based on the median estimate. The impact is unknown for 11.6 km of perennial stream for the 5th percentile and median estimates (Figure 34, Figure 35). A greater change in baseflow index was modelled for the 5th and 95th percentile estimates but the changes in baseflow index were small (<0.01). The impact is unknown for 36.6 km of perennial stream for the 95th percentile estimate (Figure 34, Figure 35). Overall, it is unlikely that any length of perennial gravel/cobble stream will be subject to a detectable change in baseflow index.
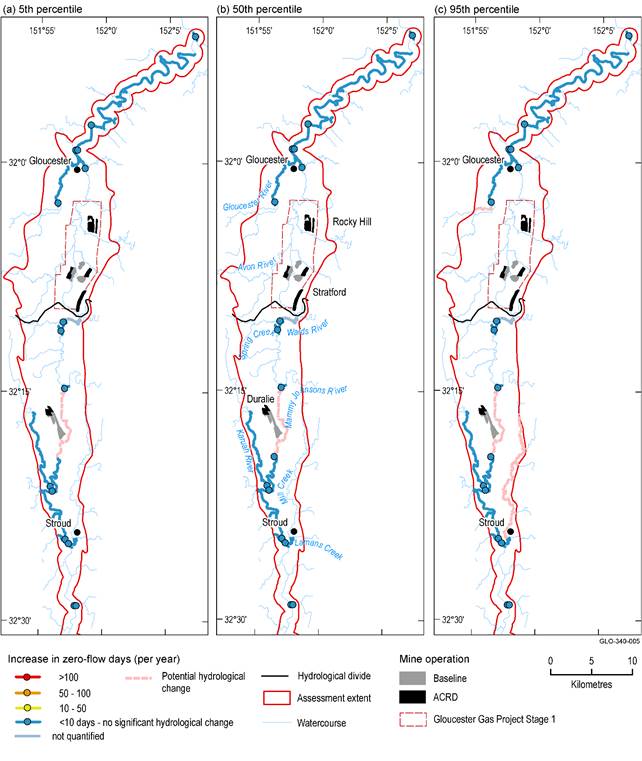
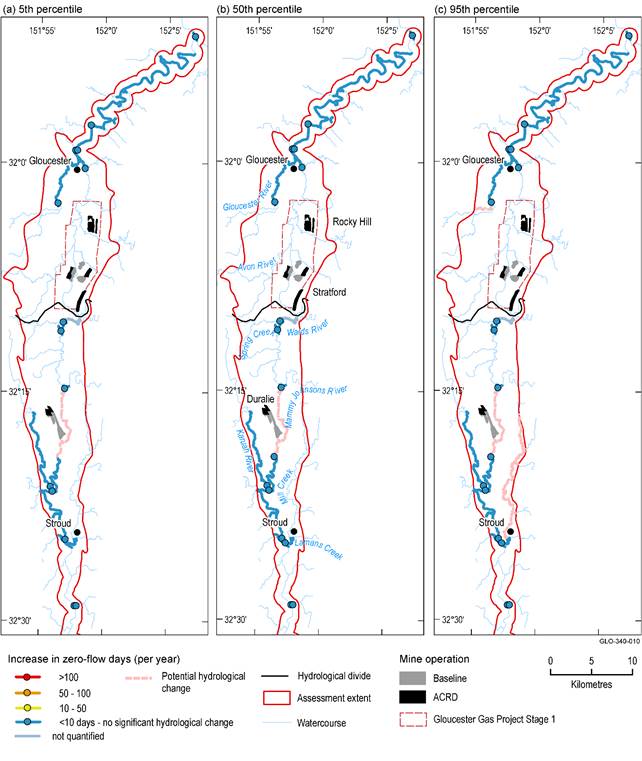
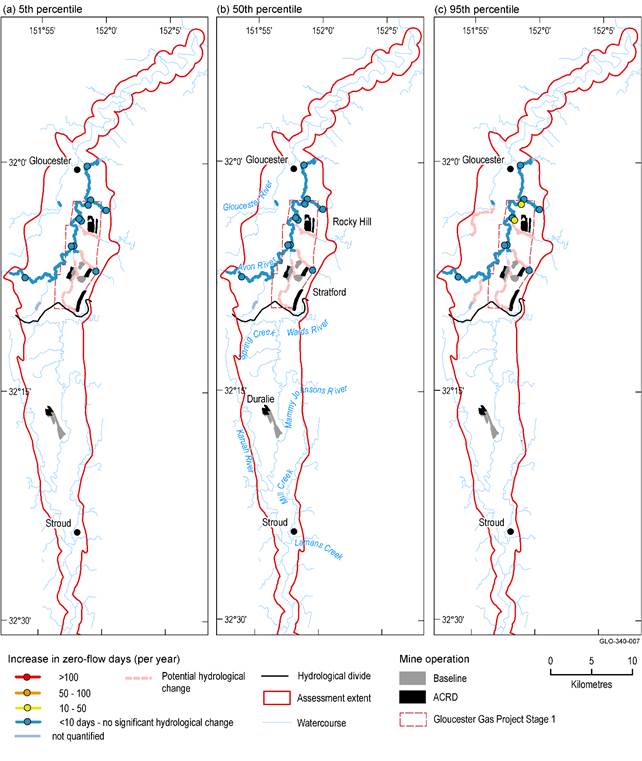
Based on the median estimates, it is likely that there will be little change in zero-flow days resulting from additional coal resource development. The median estimate of stream length with no change resulting from additional coal resource development is 94.5 km in the 30-year periods preceding both 2042 (Figure 36) and 2102 (Figure 37, Table 17). This is the entire length of perennial gravel/cobble streams in the zone of potential hydrological change (excepting the length of streams with ‘potential hydrological change’ east of the Duralie mine where changes cannot be ruled out). The 95th percentile estimate is that approximately 8 km of stream length (including a section of Wards River and the Avon and Gloucester rivers near their junction) will experience an increase of 0–10 zero-flow days (Table 17, Figure 37) in the two 30-year periods. The impact is unknown for 36.6 km of perennial stream for the 95th percentile estimate, including parts of Mammy Johnsons River, Mill Creek and a section of the Gloucester River. Overall, it is very unlikely that the length of perennial stream subject to an increase in zero-flow days will exceed 8 km and that the increase in zero-flow days will exceed 10 days.
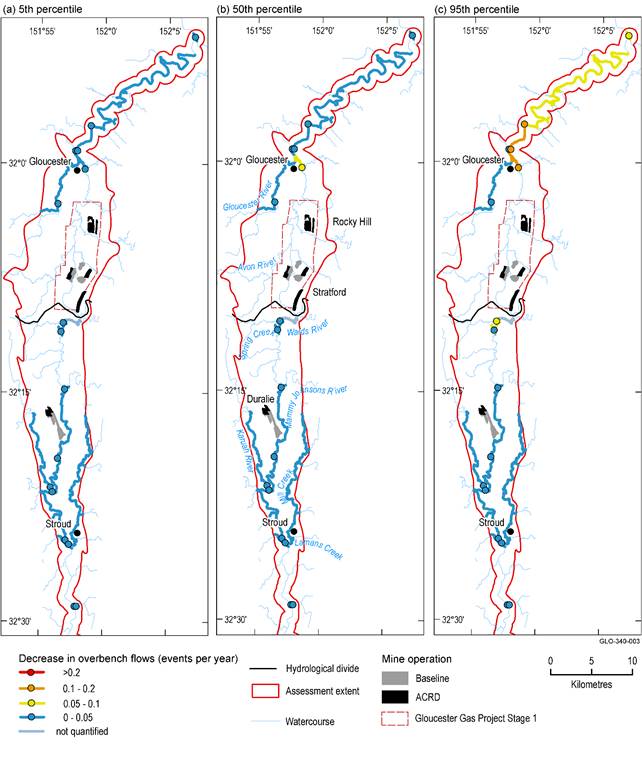
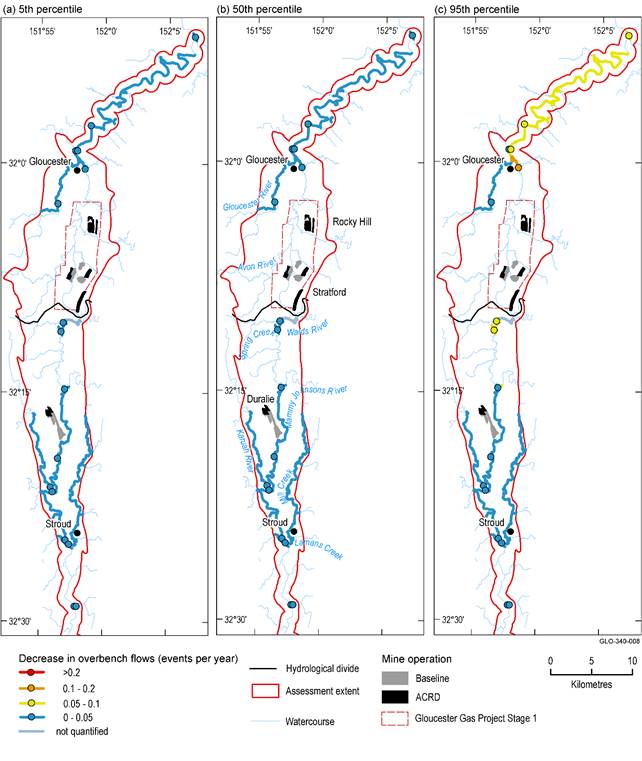
Based on the median estimates, it is likely that there will be little change in overbench flow resulting from additional coal resource development. The median estimate of perennial gravel/cobble stream length with no change resulting from additional coal resource development is 129.1 km in the 30-year period preceding 2042 (Figure 38) and 2102 (Figure 39, Table 18). A further 7.5 km of stream length is predicted to have a small (<0.2) decrease in overbench flow in the 30-year period preceding 2042, based on the median estimate. The 95th percentile estimate is that 59.8 km of stream length will experience a decreased overbench flow of up to 0.2 (Table 18) in the two 30-year periods. There is no length of stream for which the impact is unknown for overbench flow. Hence, it is very unlikely that the length of perennial stream subject to a decrease in overbench flow will exceed 59.8 km and that the impact would be greater than a 0.2 reduction in the frequency of overbench flow. A reduction of 0.2 means that there would be 0.2 fewer overbench events per year (one fewer every 5 years).
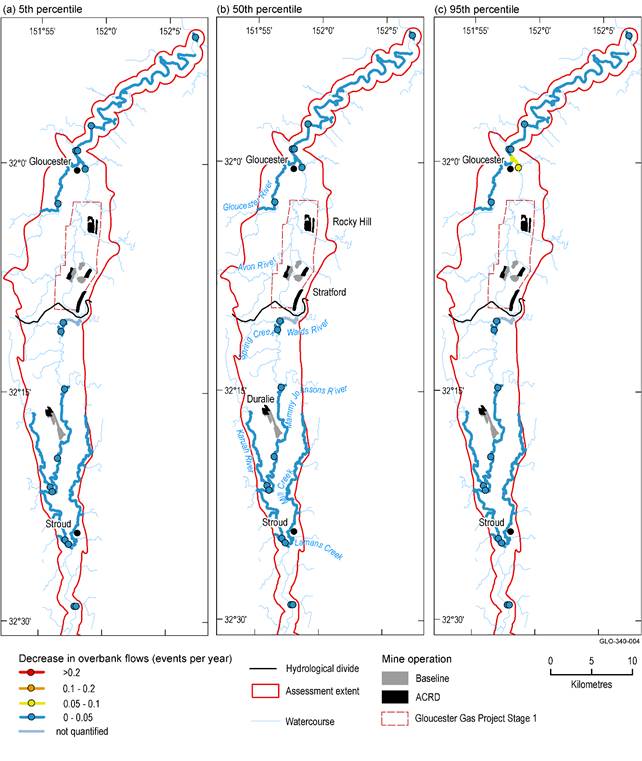
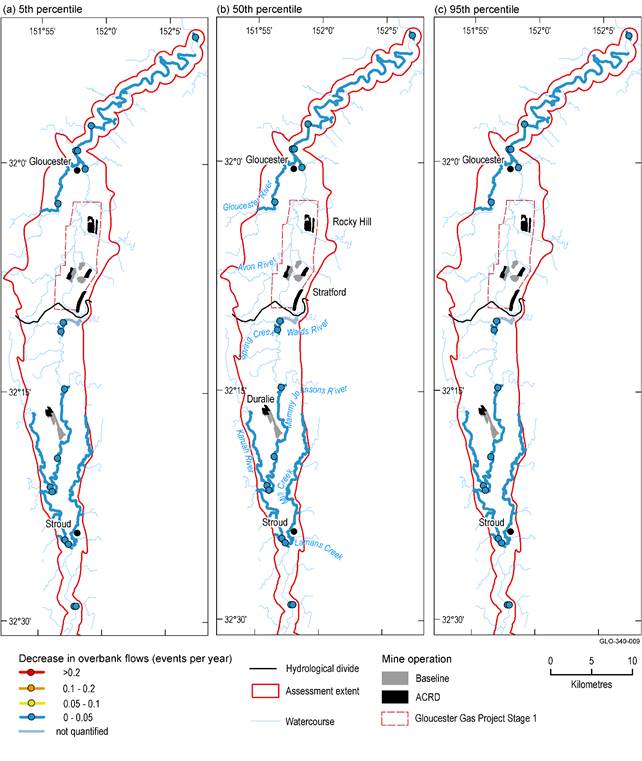
Based on the median estimates, it is likely that there will be little change in overbank flow resulting from additional coal resource development. The median estimate of stream length with no change resulting from additional coal resource development is 129.1 km in the 30-year period preceding 2042 (Figure 40, Table 19) and 131.1 km in the 30-year period preceding 2102 (Figure 41, Table 19), which is virtually the entire length of stream in the zone of potential hydrological change. The 95th percentile estimate is that 49.2 km of stream length will experience a decreased overbank flow of up to 0.05 (Table 19) in the 30-year period preceding 2042, and that 16.2 km of stream length will experience a decreased overbank flow of up to 0.02 (Table 19) in the 30-year period preceding 2102. There is no length of stream for which the impact is unknown for overbank flow. Hence, it is very unlikely that the length of perennial gravel/cobble streams subject to a decrease in overbank flow will exceed 49.2 km and that the impact would be greater than a 0.02 reduction in the frequency of overbank flow. A reduction of 0.02 means there would be 0.02 fewer overbank events per year (one fewer every 50 years).
Overall, it is unlikely that perennial gravel/cobble streams in the Gloucester assessment extent will be significantly impacted by groundwater drawdown, change in baseflow index or increased zero-flow days as a result of additional coal resource development. There is an unquantified risk along a section of Mammy Johnsons River, to the east of Duralie mine, and local-scale information is needed to determine the actual risk here. Small decreases in the frequency of overbench and overbank flows are possible in short reaches of the perennial gravel/cobble streams.
ACRD = additional coal resource development, CSG = coal seam gas
Data: Bioregional Assessment Programme (Dataset 1, Dataset 3, Dataset 8, Dataset 9)
ACRD = additional coal resource development, CSG = coal seam gas
Data: Bioregional Assessment Programme (Dataset 1, Dataset 3, Dataset 8, Dataset 9)
ACRD = additional coal resource development, CSG = coal seam gas
Data: Bioregional Assessment Programme (Dataset 1, Dataset 3, Dataset 8, Dataset 9)
ACRD = additional coal resource development, CSG = coal seam gas
Data: Bioregional Assessment Programme (Dataset 1, Dataset 3, Dataset 8, Dataset 9)
ACRD = additional coal resource development, CSG = coal seam gas
Data: Bioregional Assessment Programme (Dataset 1, Dataset 3, Dataset 8, Dataset 9)
ACRD = additional coal resource development, CSG = coal seam gas
Data: Bioregional Assessment Programme (Dataset 1, Dataset 3, Dataset 8, Dataset 9)
ACRD = additional coal resource development, CSG = coal seam gas
Data: Bioregional Assessment Programme (Dataset 1, Dataset 3, Dataset 8, Dataset 9)
ACRD = additional coal resource development, CSG = coal seam gas
Data: Bioregional Assessment Programme (Dataset 1, Dataset 3, Dataset 8, Dataset 9)
Table 15 Cumulative stream length (km) of perennial – gravel/cobble streams potentially exposed to varying levels of drawdown (dmaxRef) due to additional coal resource development, in the year that the maximum decrease of groundwater occurs (tmaxRef)
The area potentially exposed to ≥0.2, ≥2 and ≥5 m additional drawdown is shown for the 5th, 50th and 95th percentiles. Excludes areas within mine pit exclusion zones.
Data: Bioregional Assessment Programme (Dataset 1)
Table 16 Stream length (km) of perennial – gravel/cobble streams potentially exposed to varying baseflow index (QBFI) due to additional coal resource development, in the years 2042 and 2102
Stream length potentially exposed to no change, ≥0.01 decrease, 0–0.01 decrease, 0–0.01 increase, and ≥0.01 increase in baseflow index is shown for the 5th, 50th and 95th percentiles. Excludes stream length where the magnitude of the potential change could not be quantified.
Data: Bioregional Assessment Programme (Dataset 1)
Table 17 Cumulative stream length (km) of perennial – gravel/cobble streams potentially exposed to varying zero-flow days (ZQD) due to additional coal resource development, in the years 2042 and 2102
Stream length potentially exposed to no change, >0, ≥10, ≥50 and ≥100 days of additional zero-flow days is shown for the 5th, 50th and 95th percentiles. Excludes stream length where the magnitude of the potential change could not be quantified.
Data: Bioregional Assessment Programme (Dataset 1)
Table 18 Cumulative stream length (km) of perennial – gravel/cobble streams potentially exposed to varying overbench flow (EventsR0.3) due to additional coal resource development, in the years 2042 and 2102
Stream length potentially exposed to no change, >0, ≥0.2, ≥0.5 and ≥1 decrease in overbench flows per year is shown for the 5th, 50th and 95th percentiles. Excludes stream length where the magnitude of the potential change could not be quantified.
Data: Bioregional Assessment Programme (Dataset 1)
Table 19 Cumulative stream length (km) of perennial – gravel/cobble streams potentially exposed to varying overbank flow (EventsR3.0) due to additional coal resource development, in the years 2042 and 2102
Stream length potentially exposed to no change, >0, ≥0.02, ≥0.05 and ≥0.1 decrease in overbank flows per year is shown for the 5th, 50th and 95th percentiles. Excludes stream length where the magnitude of the potential change could not be quantified.
Data: Bioregional Assessment Programme (Dataset 1)
3.4.3.2.2 ‘Intermittent – gravel/cobble streams’ landscape class
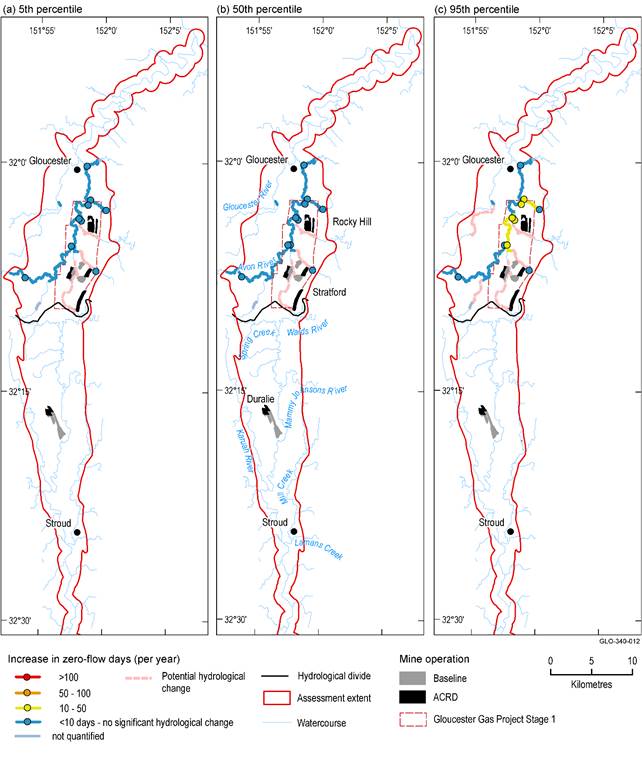
One surface water hydrological factor and associated hydrological response variable was identified for the ‘Intermittent – gravel/cobble streams’ landscape class, which is the mean number of days per year with zero streamflow during a 30-year period (ZQD). For details of this variable, the reader is referred to Section 2.7.3 of companion product 2.7 for the Gloucester subregion (Hosack et al., 2018b). The total length of intermittent gravel/cobble streams in the zone of potential hydrological change is 78 km. Of this, the 5th percentile and median estimates of stream length with an unknown impact resulting from additional coal resource development is 19 km and the 95th percentile estimates of stream length with an unknown impact is 29 km (Figure 42 and Figure 43). Based on the median estimates, it is likely that there will be little change in zero-flow days resulting from additional coal resource development. The median estimate of stream length with no change resulting from additional coal resource development is 52 km in the 30-year periods preceding both 2042 and 2102 (Table 20), which is almost the entire length of stream in the zone of potential hydrological change for which there is a quantifiable impact. In contrast, the 95th percentile estimate is that most of the stream length will experience an increase of up to 10 zero-flow days (Table 20), and in the 30-year period preceding 2102 it is predicted that 12 km of stream will have an increase of 10–50 zero-flow days.
Overall, modelling results suggest at least a 5% chance of increases in zero-flow days in short sections of the intermittent gravel/cobble streams as a result of additional coal resource development. Changes in zero-flow days along the intermittent gravel/cobble streams close to the Stratford and Rocky Hill mines, which were not modelled, cannot be ruled out. Local scale information is needed to determine the level of risk to instream and riparian habitats associated with these potentially impacted streams.
ACRD = additional coal resource development, CSG = coal seam gas
Data: Bioregional Assessment Programme (Dataset 1, Dataset 3, Dataset 8, Dataset 9)
ACRD = additional coal resource development, CSG = coal seam gas
Data: Bioregional Assessment Programme (Dataset 1, Dataset 3, Dataset 8, Dataset 9)
Table 20 Cumulative stream length (km) of intermittent – gravel/cobble streams potentially exposed to varying zero-flow days (ZQD) due to additional coal resource development, in the years 2042 and 2102
Stream length potentially exposed to no change, >0, ≥10, ≥50 and ≥100 days of additional zero-flow days is shown for the 5th, 50th and 95th percentiles. Excludes stream length where the magnitude of the potential change could not be quantified.
Data: Bioregional Assessment Programme (Dataset 1)
3.4.3.3 Potential ecosystem impacts
3.4.3.3.1 ‘Perennial – gravel/cobble streams’ landscape class
The receptor impact models for perennial gravel/cobble streams identified potential relationships between the hydrological response variables described in Section 3.4.3.2 and three indicators of ecological condition:
- annual mean percent canopy cover of woody riparian vegetation (predominately Casuarina cunninghamiana, Melia azedarach, Eucalyptus amplifolia and Angophora subvelutina) in a transect 20 m wide and 100 m long covering the bottom of the stream bench to the high bank, to groundwater drawdown, and altered overbench and overbank flow
- mean number of larvae of the Hydropsychidae family (net-spinning caddisflies) in a 1 m2 sample of riffle habitat, to changes in zero-flow days
- mean number of the eel-tailed catfish (Tandanus tandanus) in a 600 m2 transect whose long axis lies along the mid-point of the stream, to changes in zero-flow days and the baseflow index.
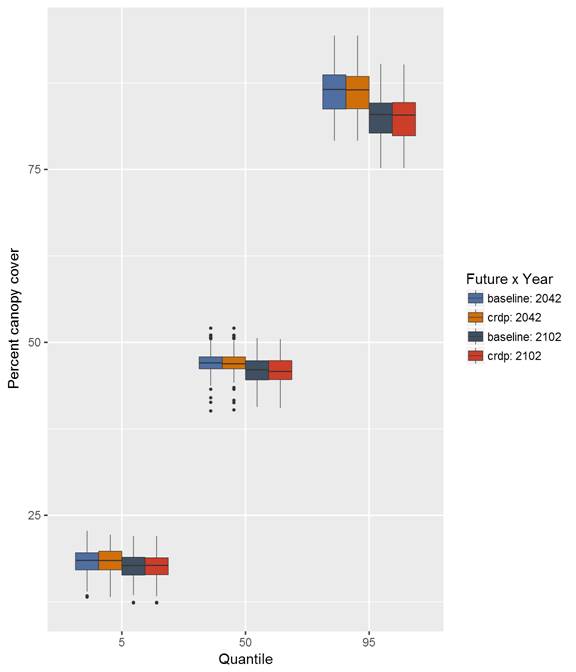
There was great uncertainty surrounding absolute values of percent canopy cover in perennial gravel/cobble streams in the Gloucester assessment extent in both the baseline and coal resource development (CRDP) futures, and in the assessment years 2042 and 2102 (Figure 44). Estimates of percent canopy ranged from <10% to >90%. Median estimates of the percent canopy cover in the baseline and coal resource development futures ranged from approximately 40% to 50% (Figure 44).
There was no evidence that percent canopy cover would differ between the two futures for either the 5th percentile, median or 95th percentile estimates (Figure 44).
The 5th percentile and median estimates of percent canopy cover suggest that there would be little difference between the assessment years 2042 and 2102 (Figure 44). The 95th percentile estimate suggests that percent canopy cover could be approximately 5% smaller in 2102 than in 2042.
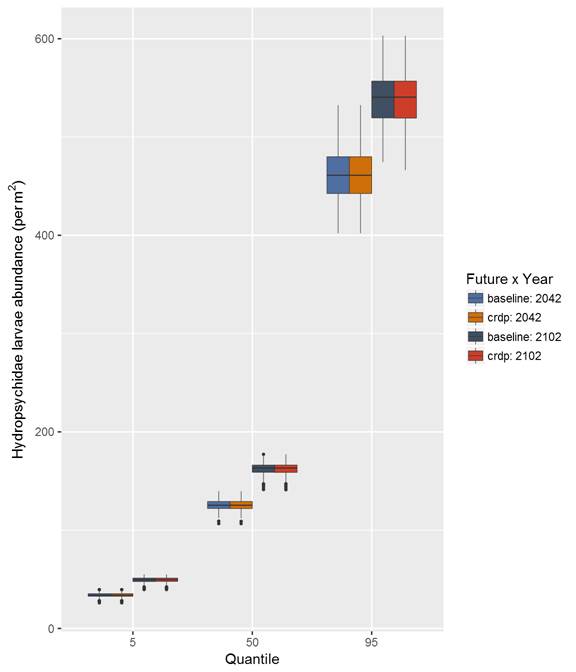
There was great uncertainty surrounding absolute numbers of Hydropsychidae larvae in 1 m2 of perennial gravel/cobble streams in the Gloucester assessment extent in both the baseline and coal resource development futures, and in the assessment years 2042 and 2102 (Figure 45). Estimates of numbers of Hydropsychidae larvae ranged from <20 to >600 per 1 m2. Median estimates of the number of Hydropsychidae larvae per 1 m2 in the baseline and coal resource development futures ranged from approximately 100 to 180 (Figure 45).
There was no evidence that the number of Hydropsychidae larvae per 1 m2 would differ between the two futures for either the 5th percentile, median or 95th percentile estimates (Figure 45).
The 5th percentile, median and 95th percentile estimates suggest that the number of Hydropsychidae larvae per 1 m2 could be approximately 10% to 30% larger in 2102 than in 2042 (Figure 45).
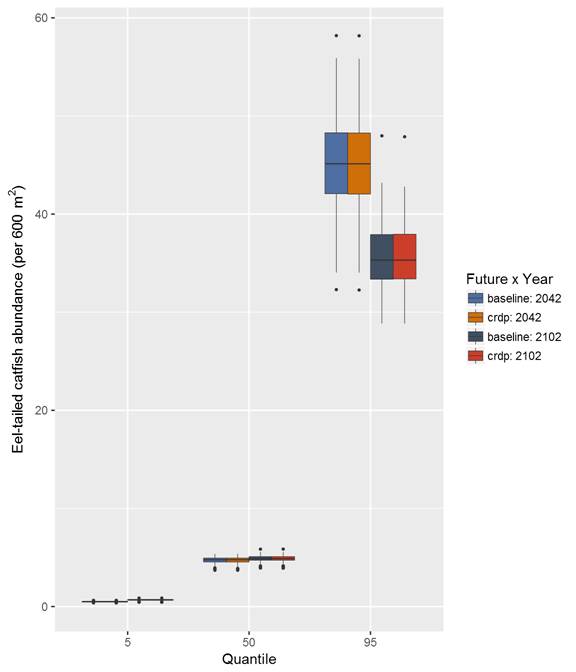
There was great uncertainty surrounding absolute numbers of eel-tailed catfish per 600 m transect of perennial gravel/cobble streams in the Gloucester assessment extent in both the baseline and coal resource development futures, and in the assessment years 2042 and 2102 (Figure 46). Estimates of numbers of eel-tailed catfish ranged from <1 to >50 per 600 m transect. Median estimates of the number of eel-tailed catfish per 600 m transect in the baseline and coal resource development futures ranged from approximately 4 to 6 (Figure 46).
There was no evidence that the number of eel-tailed catfish per 600 m transect would differ between the two futures for either the 5th percentile, median or 95th percentile estimates (Figure 46).
The 5th percentile and median estimates suggest that the number of eel-tailed catfish per 600 m transect would be no different in 2102 than in 2042 (Figure 46). The 95th percentile estimate suggests that the number of eel-tailed catfish per 600 m transect could be approximately 20% smaller in 2102 than in 2042.
Overall, the modelled results suggest little detectable change to the condition of perennial gravel/cobble streams in the Gloucester subregion owing to additional coal resource development but that there is very high uncertainty surrounding estimates. This is consistent with the small modelled changes in groundwater drawdown, overbench flow, overbank flow, zero-flow days and baseflow index described in Section 3.4.3.2.1.
Data: Bioregional Assessment Programme (Dataset 1, Dataset 12)
Data: Bioregional Assessment Programme (Dataset 1, Dataset 12)
Data: Bioregional Assessment Programme (Dataset 1, Dataset 12)
3.4.3.3.2 ‘Intermittent – gravel/cobble streams’ landscape class
The receptor impact model for intermittent gravel/cobble streams focused on the relationship of mean richness of ‘hyporheic invertebrate taxa (HTR) in 6 L of water pumped from a depth of 40 cm below the streambed (riffle and gravel bars)’ to changes in zero-flow days (ZQD) as an indicator of ecological condition.
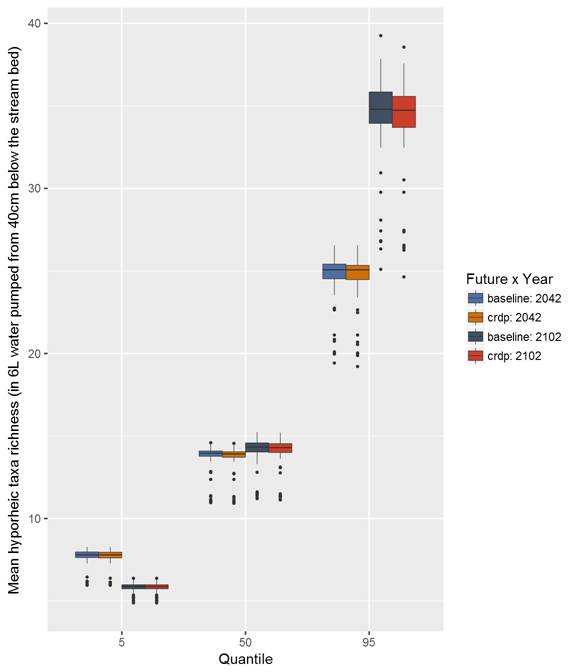
There was great uncertainty surrounding absolute values of hyporheic invertebrate taxa richness in intermittent gravel/cobble streams in the Gloucester assessment extent in both the baseline and coal resource development futures, and in the assessment years 2042 and 2102 (Figure 47). Estimates of hyporheic invertebrate taxa richness ranged from <10 to >35 taxa in 6 L of water pumped from a depth of 40 cm below the streambed (riffle and gravel bars). Median estimates of hyporheic invertebrate taxa richness in the baseline and coal resource development futures ranged from approximately 13 to 15 (Figure 47).
There was no evidence that values of hyporheic invertebrate taxa richness would differ between the two futures for either the 5th percentile, median or 95th percentile estimates (Figure 47).
The median estimate suggests that hyporheic invertebrate taxa richness would be no different in 2102 than in 2042 (Figure 47). The 5th percentile estimate suggests that hyporheic invertebrate taxa richness could be approximately 30% smaller in 2102 than in 2042, while the 95th percentile estimate suggests that hyporheic invertebrate taxa richness could be approximately 35% larger in 2102 than in 2042 (Figure 47).
Overall, the modelled results suggest little detectable impact on the condition of intermittent gravel/cobble streams in the Gloucester subregion due to additional coal resource development but that there is very high uncertainty surrounding estimates. This is consistent with the small modelled changes in zero-flow days described in Section 3.4.3.2.2.
Data: Bioregional Assessment Programme (Dataset 1, Dataset 12)
