The zone of potential hydrological change is the area within the subregion where changes in hydrology due to additional coal resource development exceed defined thresholds for groundwater and surface water changes. The impact and risk analysis presented in the remainder of this product focuses on landscape classes and assets that intersect this zone. Any landscape class or asset wholly outside of the zone of potential hydrological change is considered very unlikely (less than 5% chance) to experience hydrological changes due to additional coal resource development, and thus is ‘ruled out’ from any further analysis as part of this BA.
The zone of potential hydrological change is defined as the union of the groundwater zone of potential hydrological change (Section 3.3.1.1) and the surface water zone of potential hydrological change (Section 3.3.1.2), clipped to the assessment extent. It is further described in Section 3.3.1.3.
3.3.1.1 Groundwater
The groundwater zone of potential hydrological change is defined as the area with a greater than 5% chance of exceeding 0.2 m of drawdown in the regional watertable due to additional coal resource development. This 5% chance is determined based on an uncertainty analysis as described in Section 2.6.2.8 of companion product 2.6.2 for the Gloucester subregion (Peeters et al., 2018). It means that 95% of groundwater model runs exceeded this level of drawdown. Groundwater impacts due to coal mines and CSG projects are regulated under state legislation and state regulatory and management frameworks. The 0.2 m drawdown threshold adopted in BAs is consistent with the most conservative minimal impact threshold in the NSW Aquifer Interference Policy (DPI, 2012) and Queensland’s Water Act 2000.
Figure 12 shows the areas with a greater than 5% chance of drawdown exceeding 0.2 m under the baseline, under the CRDP and due to additional coal resource development. Under the baseline, this corresponds to an area of 140 km2 (29% of the 481 km2assessment extent). It increases to 206 km2 (42% of assessment extent) under the CRDP, which represents the combined effect of drawdown under the baseline and due to additional coal resource development. However, it is the area with a greater than 5% chance of drawdown exceeding 0.2 m due to additional coal resource development (Figure 12c) that forms the basis of the groundwater zone of potential hydrological change and this covers an area of 100 km2. Of this, 52 km2 also experiences greater than 0.2 m of drawdown under the baseline. It is this area of overlap where there is potential for cumulative impacts due to baseline and additional coal resource developments.
The groundwater zone of potential hydrological change for the Gloucester subregion is shown in Figure 12c. It consists of an area of 88 km2 in the Gloucester river basin, and 12 km2 north-west of Stroud in the Karuah river basin. These two areas are around the proposed Rocky Hill Coal Project, Stratford expansion and the Gloucester Gas Project Stage 1 CSG field in the north, and the proposed Duralie expansion in the south.
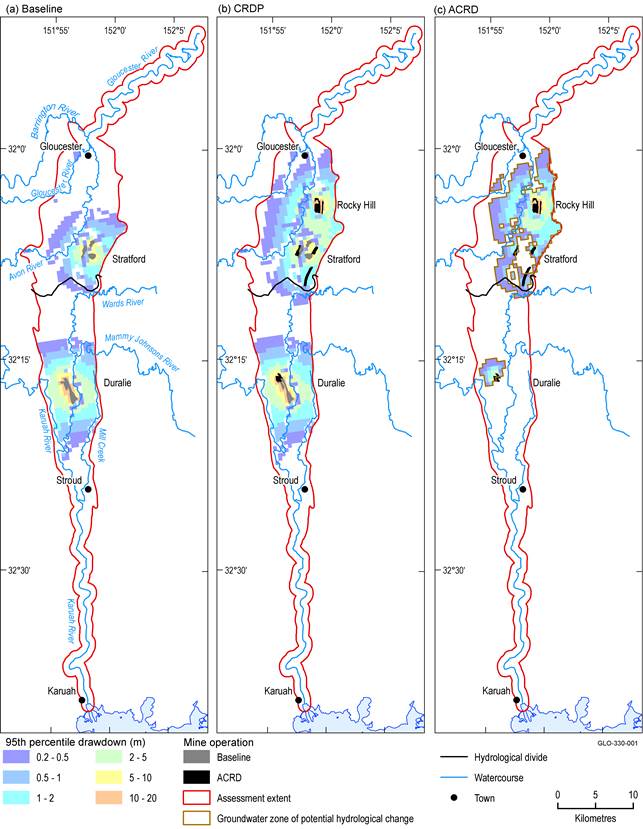
The difference in drawdown between CRDP and baseline is due to the ACRD. Drawdowns under the baseline and CRDP are relative to drawdown with no coal resource development.
Data: Bioregional Assessment Programme (Dataset 1)
3.3.1.2 Surface water
In companion product 2.6.1 for the Gloucester subregion (Zhang et al., 2018), the potential hydrological changes in surface water are summarised by eight hydrological response variables listed in Table 5, as per submethodology M06 (as listed in Table 1) for surface water modelling (Viney, 2016). These hydrological response variables were chosen to represent potential changes across the full flow regime: from low flows (P01, LFD, LFS, LLFS) to high flows (P99 and FD), including two hydrological response variables to represent changes in flow volume (AF) and variability (IQR). All hydrological response variables were calculated at annual time steps. The hydrological response variable, zero-flow days (ZFD) was not used in assessing hydrological changes because the vast majority of streams in the Gloucester subregion are perennial (see companion product 2.6.1 (Zhang et al., 2018)). Additional hydrological response variables have been defined for receptor impact modelling (see companion submethodology M08 (as listed in Table 1) (Hosack et al., 2018a)) and assessing economic impacts, and are considered further in the impacts on landscape classes and assets sections (Section 3.4 and Section 3.5, respectively) of this product. While maximum change in zero-flow days (ZFD) was not used to describe hydrological changes, the variable ZQD representing the average change in zero-flow days over a 30-year time period was used as an input into the receptor impact modelling. Results for this hydrological response variable are presented in Section 3.4.
Table 5 Surface water hydrological response variables and the thresholds used to define the zone of potential hydrological change
aZFD is not used in assessing hydrological changes because the vast majority of streams in the Gloucester subregion are perennial (see product 2.6.1 for the Gloucester subregion (Zhang et al., 2018)).
The definitions of the thresholds for each variable that were adopted for defining the zone of potential hydrological change are also given in Table 5. A location is deemed to be potentially impacted by hydrological changes due to additional coal resource development if the change in at least one of the eight variables exceeds its specified threshold. Probability estimates are derived from the predictions of 1000 model replicates – each of which uses a unique set of model parameter values. The 5% threshold means that at least 5% (i.e. 50) of the 1000 replicates have modelled changes that exceed the relevant change threshold. Conversely, if fewer than 5% of the replicates have modelled changes that exceed the threshold at a particular location, then the change in that hydrological response variable at that location is considered very unlikely (less than 5% chance) to have an impact.
As well as some of the reaches that make up the AWRA-L surface water network, the surface water zone of potential hydrological change includes some small stream reaches that are not represented in the model. The methods for extending the modelled network to include other streams potentially impacted by hydrological changes are as follows:
- Stream reaches in the groundwater zone of potential hydrological change that were not modelled were classified as ‘potentially impacted’ on the assumption that any streams connected to regional groundwater could potentially be affected by changes in baseflow due to additional coal resource development.
- Stream reaches that flowed beyond the groundwater zone of potential hydrological change were extended downstream to where they joined a reach already in the surface water zone of potential hydrological change.
The surface water zone of potential hydrological change is shown in Figure 13. It comprises potentially impacted reaches and adjoining areas from the associated assessment units. It covers an area of 187 km2, with approximately 117 km2 in the Gloucester river basin and 70 km2 in the Karuah river basin. The resulting surface water zone of potential hydrological change includes all modelled reaches shown in Figure 8 (Section 3.2) that are within the assessment extent except for those in the Barrington River, Booral Creek and the Karuah River below Booral Creek. Additionally, it includes three unmodelled reaches in the Gloucester river basin: Sandy Creek (a tributary of the Gloucester River), Avondale Creek (a tributary of the Avon River), and an unnamed tributary of the Avon River.
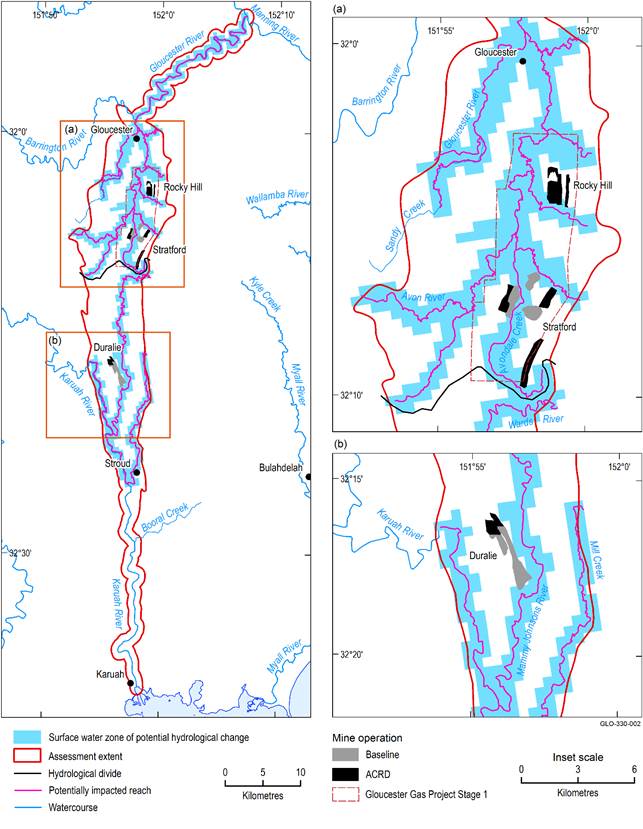
Figure 13 Surface water zone of potential hydrological change
The extent of the mines in the CRDP is the union of the extents in the baseline and in the additional coal resource development (ACRD).
The surface water zone of potential hydrological change is the area where a change in any one of eight surface water hydrological response variables exceeds the specified thresholds (Table 5).
Data: Bioregional Assessment Programme (Dataset 1)
3.3.1.3 Zone of potential hydrological change
The zone of potential hydrological change (Figure 14) represents the union of the groundwater zone of potential hydrological change (Figure 12) with the surface water zone of potential hydrological change (Figure 13), clipped to the assessment extent. The Gloucester zone covers an area of 250 km2 and has 242 km of stream network. A graphical summary of the areas (km2) of the zone and its surface and groundwater components is provided in Figure 15.
Mill Creek is included in the zone of potential hydrological change, even though it is not particularly close to the additional coal resource development at Duralie. This could be an artefact of the modelling as the pumping point in the groundwater model was moved from the middle of the baseline pit in the baseline model run to the middle of the additional pit in the CRDP run. This resulted in slight increases in groundwater levels in the CRDP run compared to the baseline run, which are reflected as changes in baseflow to the surface water model. It is unlikely that Mill Creek is impacted due to additional coal resource development.
Figure 14 also shows the mine pit exclusion zone defined for the Gloucester subregion based on open-cut mine footprints under the CRDP in the zone of potential hydrological change. The mine pit exclusion zone identifies areas in the zone of potential hydrological change that are within or near open-cut mine pits, and where:
- modelled drawdowns are highly uncertain due to the very steep hydraulic gradients at the mine pit interface
- changes in drawdown are inevitable where the mine pit intersects the regional watertable
- other factors, such as physical removal of a wetland or creek, may have a larger impact on a landscape class than the predicted decrease in groundwater level
- impacts are predominantly site-scale, assumed to be adequately addressed through existing development approval processes, and hence not the primary focus of BAs.
The modelled estimates of drawdown in this zone are considered unreliable for use in the receptor impact modelling. Local-scale groundwater models are expected to give better estimates of drawdown around mine pits than is possible using a regional-scale model.
The Gloucester mine pit exclusion zone covers an area of 14.5 km2 (10 km2 of which is in the groundwater zone of potential hydrological change; Figure 15) and includes an area around each of the three mines at Rocky Hill, Stratford and Duralie. There is no exclusion zone identified for CSG wells or infrastructure associated with the Gloucester Gas Project.
It is worth noting that some of the area defined by the mine pit exclusion zone around the baseline Duralie mine as well as the area immediately south of this are outside the zone of potential hydrological change. Groundwater levels in this area are subject to drawdown due to the baseline mine as shown in Figure 12a, but the small expansion (relative to the baseline area) of this mine pit, modelled as part of the additional coal resource development, does not have a big effect on drawdown over much of this area.
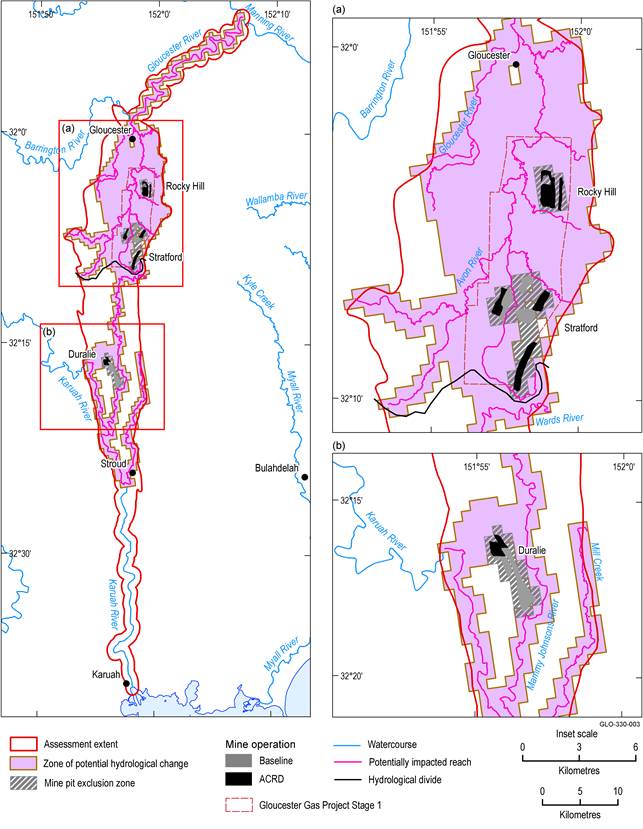
Figure 14 Zone of potential hydrological change
The zone of potential hydrological change is the union of the groundwater zone of potential hydrological change and the surface water zone of potential hydrological change.
ACRD = additional coal resource development
Data: Bioregional Assessment Programme (Dataset 1)
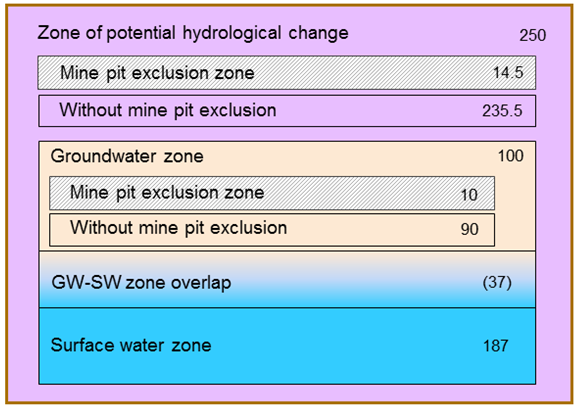
GW = groundwater, SW = surface water
Data: Bioregional Assessment Programme (Dataset 1)
In the impacts on landscape classes and assets sections (Section 3.4 and Section 3.5, respectively), the initial ‘rule-out’ assessment determines what is in the zone of potential hydrological change and, within that, what is in the mine pit exclusion zone. Features that have a groundwater dependency and occur in the mine pit exclusion zone do not have receptor impact modelling results generated for them; they are assumed to be ‘potentially impacted but not quantified’.
Changes in surface water were analysed on an individual stream link basis. Stream links, where it was determined that the change in hydrology for that stream link could not be interpolated from a nearby model node are labelled as ‘potential hydrological change’ in the maps presented in this section, and are reported in results tables under the header ‘potentially impacted but not quantified’.
