The Gloucester surface water and groundwater models were designed to quantify potential changes in hydrology caused by activities undertaken at multiple coal resource developments. This enabled an assessment of the cumulative impacts of coal resource development at a regional scale. This analysis focused on the zone of potential hydrological change, outside of which potential impacts from additional coal resource development are very unlikely (less than 5% chance). See Section 3.3.1 for more details.
3.2.3.1 Groundwater
A deeper analytic element model was coupled to a shallow numerical alluvial model to estimate spatially explicit probabilities of hydrological changes due to coal resource development. Potential hydrological changes were calculated for two futures considered in BAs: the baseline and the coal resource development pathway (CRDP). The difference in results between CRDP and baseline is the change that is primarily reported in a BA. This change is due to the additional coal resource development, which in the Gloucester subregion comprises three open-cut coal mines and one CSG field (Section 3.1.2.1).
The deeper analytic element model was developed using TTim (Bakker, 2015) to predict the response in the weathered zone to coal resource development. The bottom of the weathered zone is the lower boundary of the alluvium (where present) and the land surface layer outside of the alluvium. The analytic element model stochastically simulated the representation of faults and hydraulic properties, thus incorporating both conceptual and parameter uncertainty in the predictions. The numerical model of the alluvium was developed in MODFLOW (Harbaugh et al., 2000). It propagated the drawdown from the weathered zone below to the watertable and also predicted the change in surface water – groundwater flux to the stream network. Results were generated at model nodes across the modelling domain. Hydrological response variables representing maximum drawdown and the year of maximum drawdown were defined for summarising model results. The details of the groundwater modelling are reported in companion product 2.6.2 for the Gloucester subregion (Peeters et al., 2018).
Groundwater modelling results are reported for the regional watertable, from which most ecological assets source water. For BA purposes, the regional watertable is the upper groundwater level within the unconfined, near-surface aquifer (not perched), where pore water pressure is equal to atmospheric pressure. It was constructed by combining the watertable from all the near-surface geological units (or layers) in which it occurs. Within the Gloucester subregion, the regional watertable exists in the alluvia of the Gloucester and Karuah river systems and in the weathered and fractured zone outside these alluvia. The change in drawdown in the regional watertable was obtained from the analytic element model for the weathered and fractured zone and combined with the change in drawdown in the alluvia from the MODFLOW models.
Drawdown from the groundwater model nodes was spatially interpolated to obtain valid posterior distributions at all assessment units across the modelling domain. A Delaunay Triangulation was generated in the R package ‘tripack’ (Renka et al., 2015). For each assessment unit, the quantiles of maximum drawdown at the nodes of the triangle enclosing the assessment unit were linearly interpolated to the new location. A forward-backward cubed-root transform was applied during the interpolation to improve performance over potentially non-linear surfaces.
Section 3.3.1.1 describes how the groundwater modelling results were used to define the groundwater zone of potential hydrological change.
3.2.3.2 Surface water
Surface water modelling for the Gloucester subregion was undertaken using the Australian Water Resources Assessment landscape model (AWRA-L). Details of the application of this model to the Gloucester subregion are reported in companion product 2.6.1 (Zhang et al., 2018). No river modelling was carried out because the rivers in the subregion are unregulated and their catchments are relatively small. Instead, streamflow was predicted by accumulating output from a spatially explicit streamflow model (AWRA-L). Coal resource development affects surface water hydrology directly through disruption of surface water drainage and some aspects of operational water management, and indirectly through changes in surface water – groundwater fluxes in response to aquifer depressurisation from mine dewatering and CSG wells.
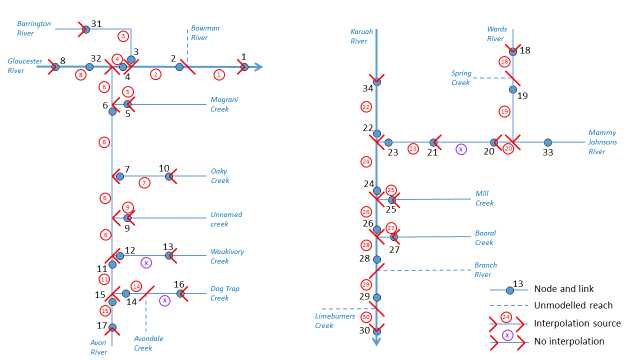
Results for eight hydrological response variables were reported for 34 model nodes across the Gloucester subregion. The locations of these model nodes are shown in Figure 7. In order to carry out the impact and risk analysis, results from these model nodes needed to be extrapolated to stream links. Extrapolating these changes is important in order to get some sense of the changes in surface water across the entire assessment extent.
The process for extrapolating hydrological response variable values from model nodes to stream links is shown schematically in Figure 8. The schematic includes a number of stream links with no model nodes (dashed lines) for which model results were not generated, but were important for doing the extrapolations. The junctions of these non-modelled streams with the modelled network correspond to significant changes in streamflow and hence represent limits to extrapolation from the nearest upstream or downstream model node. Extrapolations were also not undertaken for stream links potentially affected by changes in runoff from open-cut coal mine operations (e.g. Avondale Creek, the reach between nodes 14 and 16 on Dog Trap Creek, and the reach between nodes 12 and 13 on Waukivory Creek). Because the impact of a mine on streamflow diminishes with increasing distance downstream of the mine, it is difficult to know how far along the reach it is reasonable to extrapolate from the nearest model node before the hydrological changes at that node are no longer representative of the hydrological changes at that point in the reach. Thus, they were classified as potentially impacted and included in the zone of potential hydrological change.
Section 3.3.1.2 describes how the surface water modelling results were used to define the surface water zone of potential hydrological change.
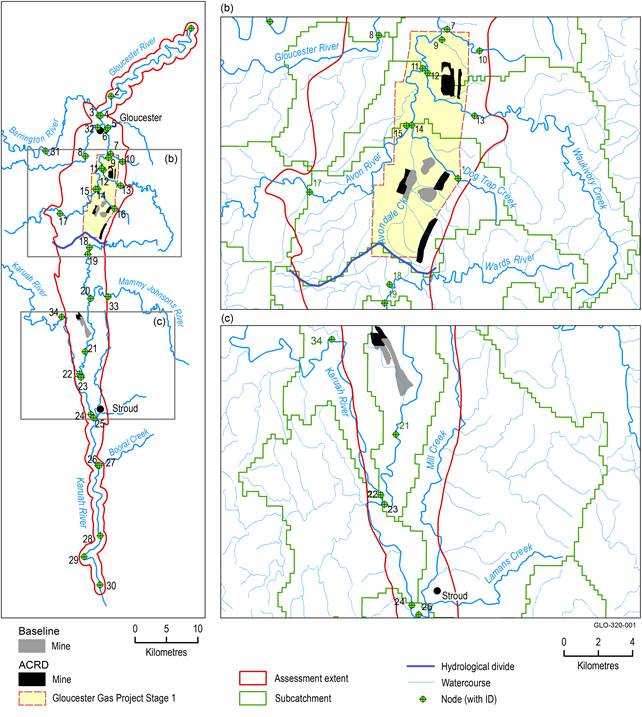
Figure 7 Surface water model nodes in the Gloucester subregion
Data: Bioregional Assessment Programme (Dataset 6, Dataset 7, Dataset 8); AGL (Dataset 5)
3.2.3.3 Representing predictive uncertainty
The models used in the assessment produced a large number of predictions of groundwater drawdown and streamflow characteristics rather than a single number. This results in a range or distribution of predictions, which are typically reported as probabilities – the percent chance of something occurring (Figure 9). This approach allowed an assessment of the likelihood of exceeding a given magnitude of change, and underpinned the assessment of the risk.
Groundwater models require information about physical properties such as the thickness of geological layers, how porous aquifers are, and whether faults are present. As the exact values of these properties are not always known, modellers used a credible range of values, which are based on various sources of data (commonly point-scale) combined with expert knowledge. The groundwater model was run thousands of times using a different set of plausible values for those physical properties each time. Historical observations, such as groundwater level and changes in water movement and volume, were used to constrain and validate the model runs.
The complete set of model runs produced a range or distribution of predictions (Figure 9) that are consistent with available observations and the understanding of the modelled system. The range conveys the confidence in model results, with a wide range indicating that the expected outcome is less certain, while a narrow range provides a stronger evidence base for decision making. The distributions created from these model runs are expressed as probabilities that drawdown or a change in streamflow will exceed relevant thresholds, as there is no single ‘best’ estimate of change.
In this assessment, the estimates of drawdown or streamflow change are shown as 95th, 50th or 5th percentile results, corresponding to a 5%, 50% or 95% chance of exceeding thresholds. Figure 10 illustrates this predictive uncertainty within a spatial context.
Throughout this product, the term ‘very likely’ is used to describe where there is a greater than 95% chance of something occurring, and ‘very unlikely’ is used where there is a less than 5% chance.
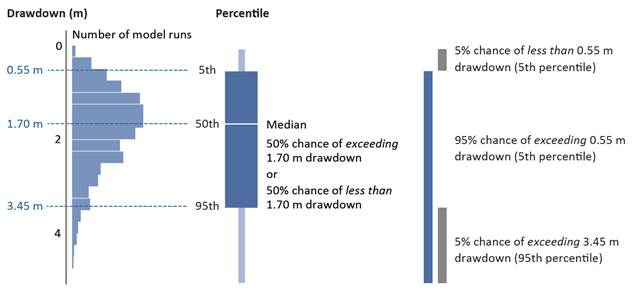
Figure 9 Illustrative example of probabilistic drawdown results using percentiles and percent chance
The chart on the left shows the distribution of results for drawdown, obtained from an ensemble of thousands of model runs that use many sets of parameters. These generic results are for illustrative purposes only and are not actual results from the Gloucester subregion.
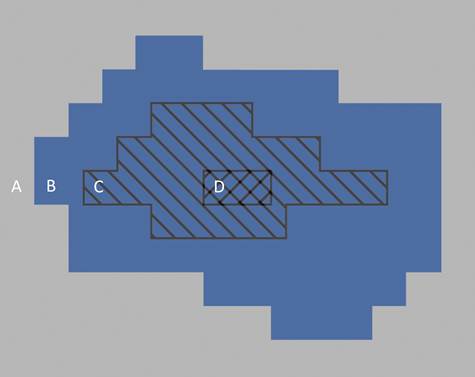
Figure 10 Illustrative example of key areas in the landscape defined by probabilistic results
The assessment extent was divided into smaller square assessment units (see Section 3.2.4.1) and the probability distribution (Figure 9) was calculated for each. In this product results are reported with respect to the following key areas:
A. outside the zone of potential hydrological change, where hydrological changes (and hence impacts) are very unlikely (defined by maps showing the 95th percentile)
B. inside the zone of potential hydrological change, comprising the assessment units with at least a 5% chance of exceeding the threshold (defined by maps showing the 95th percentile). Further work is required to determine whether the hydrological changes in the zone translate into impacts for water-dependent assets and landscapes
C. with at least a 50% chance of exceeding the threshold (i.e. the assessment units where the median is greater than the threshold; defined by maps showing the 50th percentile)
D. with at least a 95% chance of exceeding the threshold (i.e. the assessment units where hydrological changes are very likely; defined by maps showing the 5th percentile).
