- Home
- Assessments
- Bioregional Assessment Program
- Namoi subregion
- 2.6.2 Groundwater numerical modelling for the Namoi subregion
- 2.6.2.8 Uncertainty analysis
- 2.6.2.8.1 Factors included in formal uncertainty analysis
Section 2.6.2.7 described the available observations, predictions required of the model and sampling of parameter space in the design of experiment for sensitivity and uncertainty analyses. The same parameters evaluated in the sensitivity analysis are considered in the formal uncertainty analysis, although the sensitivity analysis indicated that only a limited number of these parameters influence the predictions.
As described in companion submethodology M09 (as listed in Table 1) for propagating uncertainty through models (Peeters et al., 2016) and in Section 2.6.2.1, the parameter space is constrained by the observations relevant to the predictions through a Monte Carlo sampling using the Approximate Bayesian Computation (ABC) methodology (Beaumont et al., 2002; Vrugt and Sadegh, 2013). As in any Bayesian methodology, a set of prior parameter distributions needs to be defined that encapsulates the current information and knowledge, including correlation or covariance of parameters. This is described in Section 2.6.2.8.1.1.
The prior parameter distributions are constrained by observations with the ABC methodology to generate posterior parameter distributions. The posterior parameter distributions are then used to generate the final set of predictions from which the uncertainty of drawdown due to additional coal resource development (i.e. maximum difference in drawdown, dmax) and year of maximum change (tmax) predictions can be characterised. The process of constraining the prior parameter distributions by observations is described and discussed in Section 2.6.2.8.1.2, while the resulting posterior predictive distributions are detailed in Section 2.6.2.8.1.3.
The uncertainty analysis is focused on predictions of dmax and tmax due to additional coal resource development. The surface water – groundwater fluxes generated along the river network within the groundwater model domain are inputs to the Namoi river model (see companion product 2.6.1 for the Namoi subregion (Aryal et al., 2018b)) and included in the characterisation of uncertainty of streamflow predictions in that product. Results from the groundwater modelling are summarised as a water balance across the entire modelling domain in companion product 2.5 for the Namoi subregion (Crosbie et al., 2018).
2.6.2.8.1.1 Prior parameter distributions
The model parameters are not varied directly in the sensitivity and uncertainty analyses, but rather through a set of offsets, multipliers or coefficients of depth-dependent relationships. The initial values of the model parameters and the ranges of the offsets, multipliers and coefficients listed in Table 10 are based on information available about the groundwater systems, summarised in companion product 2.1-2.2 (Aryal et al., 2018a) and companion product 2.3 (Herr et al., 2018) for the Namoi subregion. The ranges of parameter values reflect the uncertainty in characterising the system due to spatial variability and incomplete knowledge of the system.
The information available was not deemed sufficient to justify any other distribution than a uniform distribution. The prior parameter distributions of the parameters listed in Table 10 are all uniform distributions with ranges corresponding to the minimum and maximum values given in the table. No covariance between parameters is specified as insufficient information is available to justify specifying such covariance. Assuming no correlation between parameters is a conservative assumption as it is likely to result in wider predictive intervals.
2.6.2.8.1.2 Posterior parameter distributions
The posterior parameter distribution for each prediction is obtained by accepting the parameter combinations from the design of experiment model runs when the run satisfies predefined objective function thresholds.
The objective functions for the Namoi subregion groundwater model summarise its performance in reproducing historical groundwater levels and surface water – groundwater fluxes and predicting coal resource development water production rates, compared to estimates from the coal resource development proponents. The ABC methodology requires not only definition of an objective function, but also the threshold value above which the parameter set is deemed to be acceptable. Ideally, this threshold is based on an independent estimate of the observation error.
These three objective functions are defined for each individual prediction (i.e. each model node for which a dmax and tmax value will be computed). The contribution of each observation (groundwater level, surface water – groundwater flux or coal resource development water production rate) is weighted based on the distance between the prediction location and the observation so that matching observations close to the prediction location is more important than matching observations that are further removed from the prediction location.
For each prediction, ![]() , a set of three vectors,
, a set of three vectors, ![]() , is defined where the subscripts
, is defined where the subscripts ![]() ,
, ![]() and
and ![]() stand for groundwater level, mine water production rate and surface water – groundwater flux, respectively.
stand for groundwater level, mine water production rate and surface water – groundwater flux, respectively.
The vector ![]() is the collection of distances
is the collection of distances ![]() , the distance between groundwater level observation
, the distance between groundwater level observation ![]() and prediction
and prediction ![]() , for all
, for all ![]() observations:
observations:
|
|
(9) |
|
|
|
(10) |
|
The vector ![]() is the collection of distances
is the collection of distances ![]() , the shortest distance between coal resource development
, the shortest distance between coal resource development ![]() and prediction
and prediction ![]() , for all
, for all ![]() coal resource developments:
coal resource developments:
|
|
(11) |
|
|
|
(12) |
|
The vector ![]() is the collection of distances
is the collection of distances ![]() , the shortest distance between river reach
, the shortest distance between river reach ![]() and prediction
and prediction ![]() , for all
, for all ![]() river reaches:
river reaches:
|
|
(13) |
|
|
|
(14) |
|
The distance weighting function ![]() is defined as:
is defined as:
|
|
(15) |
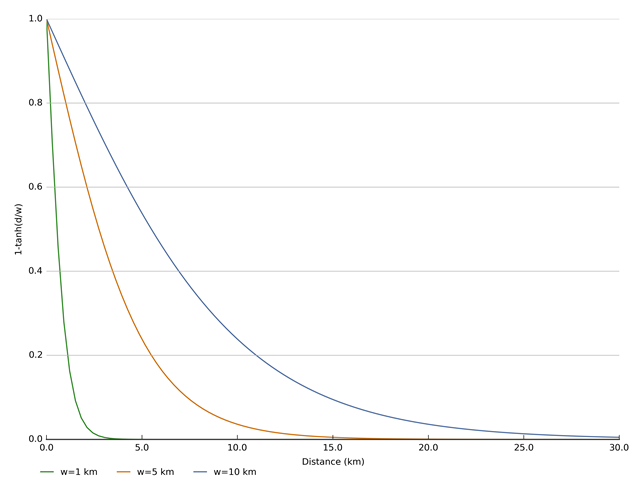
Coefficient ![]() controls how rapidly the weight decreases with increasing distance. The tanh function allows the weight of an observation to decrease almost linearly with distance and to gradually become zero at a distance of approximately
controls how rapidly the weight decreases with increasing distance. The tanh function allows the weight of an observation to decrease almost linearly with distance and to gradually become zero at a distance of approximately ![]() . This is illustrated in Figure 28 for different values of
. This is illustrated in Figure 28 for different values of ![]() . For groundwater level observations
. For groundwater level observations ![]() is set to 10 km; for mine water production rates and surface water – groundwater fluxes it is set to 20 km. This implies that a groundwater level observation residual will get a zero weight if it is more than 30 km from the prediction location, while the weight for mines and river reaches will only become zero when they are more than 60 km from the prediction location. These
is set to 10 km; for mine water production rates and surface water – groundwater fluxes it is set to 20 km. This implies that a groundwater level observation residual will get a zero weight if it is more than 30 km from the prediction location, while the weight for mines and river reaches will only become zero when they are more than 60 km from the prediction location. These ![]() values represent a pragmatic trade-off between capturing local and regional groundwater flow dynamics.
values represent a pragmatic trade-off between capturing local and regional groundwater flow dynamics.
d = distance between observation and prediction (km); w = distance weighting coefficient
Data: Bioregional Assessment Programme (Dataset 1)
Each objective function is a weighted sum of residuals. The acceptance criterion for an objective function is the objective function corresponding to a predefined acceptable threshold residual.
For groundwater level observations, the criterion becomes:
|
|
(16) |
with ![]() the distance of observation
the distance of observation ![]() to the nearest blue line network,
to the nearest blue line network, ![]() the number of observations at that location,
the number of observations at that location, ![]() the head observation and
the head observation and ![]() the simulated equivalent. The distance between the observation and the nearest blue line network is included in the objective function to reduce the weight of groundwater level observations in the immediate vicinity of rivers. At these locations, groundwater level observations are dominated by groundwater dynamics at a spatial and temporal scale that is beyond the resolution of the model. Matching such observations therefore has great potential to bias parameter estimates. Further away from the river, groundwater level observations receive a greater weight as these observations are less affected by surface water – groundwater interaction and therefore will be able to better constrain hydraulic properties.
the simulated equivalent. The distance between the observation and the nearest blue line network is included in the objective function to reduce the weight of groundwater level observations in the immediate vicinity of rivers. At these locations, groundwater level observations are dominated by groundwater dynamics at a spatial and temporal scale that is beyond the resolution of the model. Matching such observations therefore has great potential to bias parameter estimates. Further away from the river, groundwater level observations receive a greater weight as these observations are less affected by surface water – groundwater interaction and therefore will be able to better constrain hydraulic properties.
This objective function accepts simulations with a head residual less than 10 m. As the range of groundwater level observations spans about 450 m (see Section 2.6.2.7.1.1), this threshold implies that the accepted parameter combinations will at least have a normalised root mean squared error of 2.5%, which is generally considered to be acceptable for a regional groundwater model (Barnett et al., 2012). The 10 m acceptance reflects observation uncertainty, positional uncertainty (surveying), resolution uncertainty (point measurement vs grid cell) and local structural noise and boundary condition uncertainty (e.g. local pumping rates).
For coal resource development water production rates, the criterion becomes:
|
|
(17) |
with ![]() the observed water production rate and
the observed water production rate and ![]() the simulated equivalent. This objective function accepts simulations in which the mine water production rate is within an order of magnitude of the rate estimated by the various proponents in the reports supporting environmental impact statements for their development. The order of magnitude threshold allows for the water production rates to deviate from the proponents’ estimates in order to be consistent with the conceptualisation and parameterisation of the bioregional assessment (BA) model while ensuring at the same time that the stress on the system is still comparable with the planned extraction rates.
the simulated equivalent. This objective function accepts simulations in which the mine water production rate is within an order of magnitude of the rate estimated by the various proponents in the reports supporting environmental impact statements for their development. The order of magnitude threshold allows for the water production rates to deviate from the proponents’ estimates in order to be consistent with the conceptualisation and parameterisation of the bioregional assessment (BA) model while ensuring at the same time that the stress on the system is still comparable with the planned extraction rates.
For the surface water – groundwater flux, the criterion becomes:
|
|
(18) |
with ![]() the 20th percentile of streamflow and
the 20th percentile of streamflow and ![]() the simulated surface water – groundwater flux. This objective function accepts simulations for which the surface water – groundwater flux is less than the 20th percentile of observed streamflow. Note that rivers that are simulated to be losing will always meet this criterion. This threshold recognises that as the Namoi river system is largely regulated and dominantly losing water to groundwater, it is unlikely that the surface water – groundwater flux accounts for more than 20% of streamflow. Locally, more detailed information on the connection status of river reaches is available (see Section 2.1.5 in companion product 2.1-2.2 for the Namoi subregion (Aryal et al., 2018a)) or on the surface water – groundwater flux. The local connection status is, however, very much influenced by the magnitude and timing of groundwater pumping and riverbed hydraulic properties. Without a commensurate effort in estimating historical groundwater pumping and riverbed hydraulic properties, constraining the model with such local information will lead to biased parameter estimates.
the simulated surface water – groundwater flux. This objective function accepts simulations for which the surface water – groundwater flux is less than the 20th percentile of observed streamflow. Note that rivers that are simulated to be losing will always meet this criterion. This threshold recognises that as the Namoi river system is largely regulated and dominantly losing water to groundwater, it is unlikely that the surface water – groundwater flux accounts for more than 20% of streamflow. Locally, more detailed information on the connection status of river reaches is available (see Section 2.1.5 in companion product 2.1-2.2 for the Namoi subregion (Aryal et al., 2018a)) or on the surface water – groundwater flux. The local connection status is, however, very much influenced by the magnitude and timing of groundwater pumping and riverbed hydraulic properties. Without a commensurate effort in estimating historical groundwater pumping and riverbed hydraulic properties, constraining the model with such local information will lead to biased parameter estimates.
2.6.2.8.1.3 Predictions
For all of the model nodes at which the 95th percentile of drawdown for the design-of-experiment runs is in excess of 0.01 m, a posterior predictive distribution is generated by filtering the results of the design of experiment with the objective functions and corresponding thresholds as outlined above. At model nodes where the 95th percentile of drawdown for the design-of-experiment runs is less than 0.01 m, the predicted dmax is set to 0 and tmax to 2102. The choice for the 0.01 m threshold is linked to the observation threshold, as any change in groundwater level of less than 0.01 m will not be able to be measured reliably. The constrained posterior parameter combinations, by definition, are a subset of the prior parameter combinations.
Figure 29 shows the fraction of evaluated parameter combinations of the design of experiment that meets the groundwater level (Figure 29b), coal resource development water production rate (Figure 29c), surface water – groundwater flux acceptance criteria (Figure 29d) and the fraction that meet all three criteria combined (Figure 29a) at the model nodes where design of experiment runs indicate potential measurable drawdown. Acceptance rate values in excess of 0.9 indicate that most parameter combinations evaluated in the design of experiment produce simulated equivalents that are within the specified acceptable range of the relevant observations.
In Figure 29b, acceptance rate based on groundwater level observations, the predictions in the Pilliga area have very high acceptance rates. This is because there are no groundwater level observations in that region and the predictions in that region are thus not constrained by groundwater level observations. To the east, in the Upper Namoi area, more observations are available and the predictions are constrained. However, the smallest acceptance rates are still in excess of 60%, indicating that more than half of the parameter combinations result in simulated values within the acceptable range of the observations.
The coal resource water production rates provide a stronger constrain on the parameters, especially in the south-east, where acceptance rates are between 50% and 60%. Contrary to the groundwater level criterion, the coal resource water production rate does constrain the predictions in the Pilliga areas, albeit to a lesser extent than in the south-east of the model domain.
The surface water – groundwater flux is not constraining the parameter combinations greatly, indicating that most parameter combinations meet the acceptance thresholds for surface water – groundwater flux.
Figure 29a shows lower acceptance rates than the maps for the individual objective functions. This implies that the objective functions are not greatly overlapping and are constraining different parameters. This is in line with the results of the sensitivity analysis in Section 2.6.2.7.
The regions where the groundwater model is not in agreement with the historical groundwater level observations (Coxs Creek, Lower Namoi and Mount Kaputar) are at a sufficiently large distance from the areas where drawdown due to additional coal resource development is simulated not to affect the predictions. This is not the case for observations close to Gunnedah, which constrain the predictions. Note that the sensitivity analysis indicated that groundwater level observations can constrain the river stage offset and to a lesser extent the diffuse recharge and horizontal hydraulic conductivity of the alluvium, but are not sensitive to the parameters that affect predictions of drawdown due to additional coal resource development (hydraulic conductivity and storage of coal-bearing units and interburden). The water production rates are sensitive to those parameters and the water production rate objective function is able to constrain the predictions of dmax and tmax.
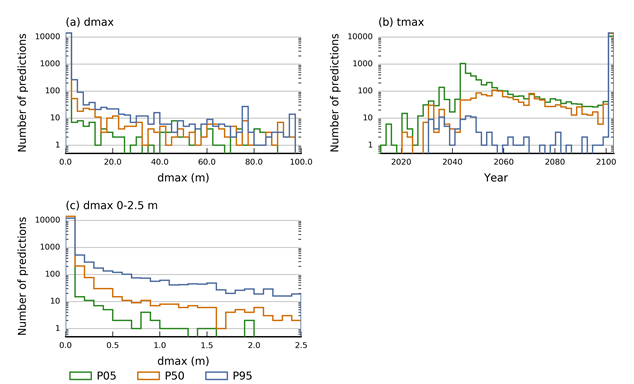
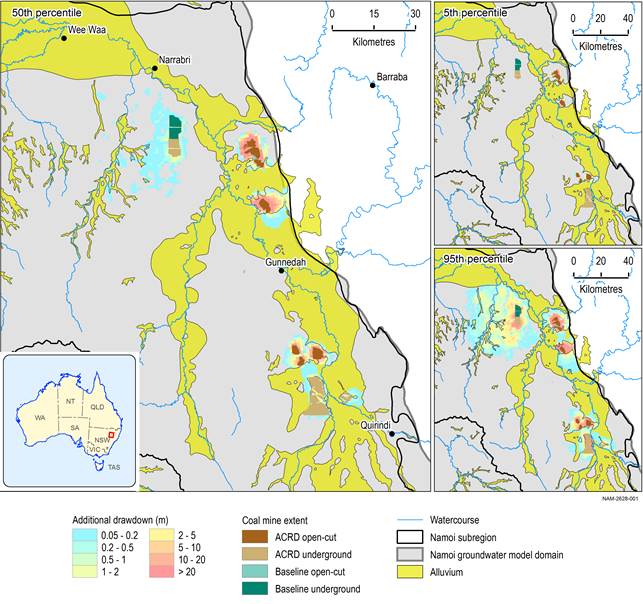
The resulting maximum difference in drawdown (dmax) due to additional coal resource development at the regional watertable and year of maximum change are summarised using the 5th, 50th and 95th percentiles. Figure 30a and Figure 30b show the histograms of the 5th, 50th and 95th percentile of dmax and tmax, respectively, at the model nodes shown in Figure 29. A log10 scale is used on the y-axis as the hydrological change is very skewed. The median drawdown due to additional coal resource development exceeds 0.2 m only at 527 model nodes, while the 95th percentile of drawdown due to additional coal resource development exceeds 2 m at 827 model nodes. Due to the high density of model nodes, many model nodes fall within mine footprints. At these model nodes, drawdown due to additional coal resource development can reach up to 260 m.
The histograms of tmax (Figure 30b) show that at most model nodes, the maximum difference in drawdown (dmax) due to additional coal resource development occurs after 2040, with a very large proportion of model nodes that have a tmax equal to 2102. This is the value assigned to all model nodes for which dmax is equal to 0 m or dmax is not realised within the simulation period.
Additional drawdown is the maximum difference in drawdown (dmax) between the coal resource development pathway (CRDP) and baseline, due to additional coal resource development; tmax = year of maximum change. A tmax value of 2102 is assigned to all predictions in which the dmax is not realised during the simulation period or the dmax is equal to 0 m. Model nodes within mine footprints have not been excluded from the histograms.
Data: Bioregional Assessment Programme (Dataset 1)
Figure 31, Figure 32 and Figure 33 show the probability of drawdown due to additional coal resource development at the regional watertable exceeding 0.2 m, 2 m and 5 m, respectively. The smaller inset maps show the probability of drawdown under baseline and under the coal resource development pathway (CRDP) exceeding 0.2 m, 2 m and 5 m, respectively.
The contour of a 5% probability of the drawdown due to additional coal resource development (i.e. maximum difference in drawdown between the CRDP and baseline) exceeding 0.2 m is used to define the zone of potential hydrological change. This polygon delineates the analysis extent for the receptor impact modelling related to groundwater in following BA products.
The zone of potential hydrological change coincides approximately with a 10 km buffer around the mine footprints, except in the Pilliga area. The combined effect of Narrabri mine and the Narrabri Gas Project result in an extensive area with a probability of less than 50% of exceeding 0.2 m drawdown due to additional coal resource development. The probability of exceeding 2 m drawdown due to additional coal resource development is limited to the area close to Narrabri mine.
The zone of potential hydrological change overlaps with the alluvium only south of the Vickery mine and between the Watermark and Caroona mines. The probability of exceeding 0.2 m is less than 50% at these locations and the exceedance probability of 2 m drawdown due to additional coal resource development reduces to approximately zero in the alluvium (Figure 32). The probability of exceeding 2 m drawdown due to additional coal resource development is generally only above 5% within 5 km of the mine footprints of the larger mines.
The difference in drawdown between the coal resource development pathway (CRDP) and baseline is due to additional coal resource development (ACRD). Drawdown under the baseline is relative to drawdown with no coal resource development; likewise, drawdown under the CRDP is relative to drawdown with no coal resource development.
Data: Bioregional Assessment Programme (Dataset 1)
2.6.2.8.1.4 Comparison with results from other models
Section 2.6.2.2 provides a list of groundwater models that have been developed on behalf of various coal resource development proponents and government agencies in the Namoi subregion. These are deterministic models, which means they provide a single estimate of hydrological change based on a single parameter combination that is considered optimal, whereas the Namoi subregion groundwater modelling package is designed to provide probabilistic ensembles of predictions, based on a range of likely parameter combinations.
The primary predictions from the Namoi subregion groundwater model are drawdown and year of maximum change (tmax) whereas the existing models are designed to provide changes in groundwater levels and fluxes at selected times in the future. Further complicating direct comparisons between model outputs are the differences in conceptualisation, boundary conditions and, critically, the implementation of coal resource development.
Given these points of difference, it is not considered warranted to make direct comparisons between results from these models and from the groundwater model developed for the Namoi subregion.
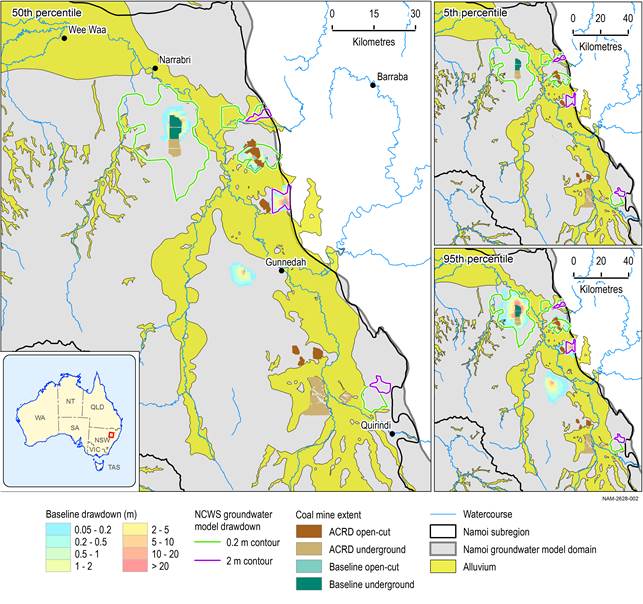
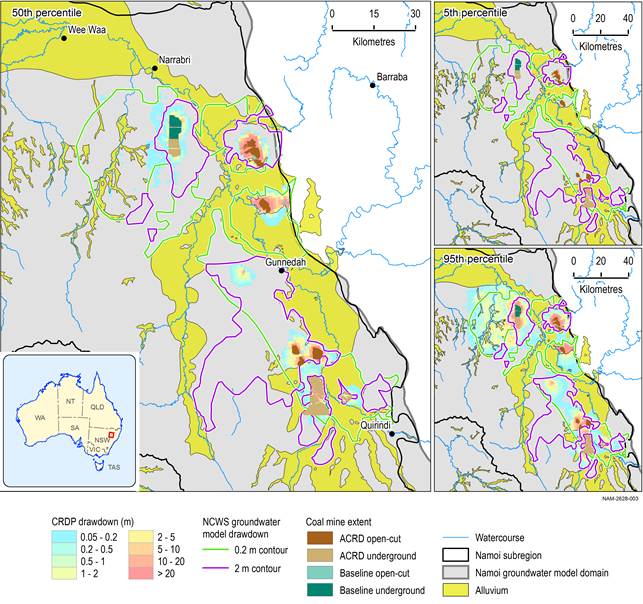
The only model that is comparable in extent and the developments included in the modelling is the Namoi Catchment Water Study (NCWS) model. Figure 34 and Figure 35 show the 5th, 50th and 95th percentiles of drawdown at the regional watertable under baseline and under CRDP (relative to no coal resource development), respectively, together with the contours of drawdown exceeding 0.2 m and 2 m from the NCWS. For completeness, Figure 36 shows drawdown due to additional coal resource development (the difference in drawdown between CRDP and baseline) at the regional watertable. This figure has no NCWS drawdown contours as no equivalent results are available in the report. Contours of the Gunnedah Basin Regional Model (GBRM) are not shown as this model only includes two developments, the Narrabri Gas Project and the Narrabri South coal mine.
These figures show that the NCWS results overall can be considered conservative as they are closer in extent to the 95th percentile of drawdown than to the 50th percentile. Noteworthy differences are that the NCWS drawdown contours extend across the interfluvium between Coxs Creek and Upper Namoi. Contrary to the NCWS model, the Namoi subregion groundwater model does not simulate coal seam gas (CSG) development in that part of the sedimentary basin as it is not part of the CRDP. This is most likely also the reason why in the south, the NCWS model does indicate that drawdowns extend into the alluvium, whereas the results of the Namoi subregion model show very limited impact in the alluvium. West of Gunnedah, drawdown is simulated in the baseline Namoi subregion model due to Sunnyside Mine (Figure 34), which is not included in the NCWS.
Figure 34 5th, 50th and 95th percentile of drawdown at the regional watertable under baseline
NCWS = Namoi Catchment Water Study
The difference in drawdown between the coal resource development pathway (CRDP) and baseline is due to additional coal resource development (ACRD). Drawdown under the baseline is relative to drawdown with no coal resource development (baseline drawdown); likewise, drawdown under the CRDP is relative to drawdown with no coal resource development (CRDP drawdown).
Data: Bioregional Assessment Programme (Dataset 1)
Additional drawdown is the maximum difference in drawdown (dmax) for one realisation within an ensemble of groundwater modelling runs, obtained by choosing the maximum of the time series of differences between two futures
The difference in drawdown between the coal resource development pathway (CRDP) and baseline is due to additional coal resource development (ACRD). Drawdown under the baseline is relative to drawdown with no coal resource development; likewise, drawdown under the CRDP is relative to drawdown with no coal resource development.
Data: Bioregional Assessment Programme (Dataset 1)

Product Finalisation date
- 2.6.2.1 Methods
- 2.6.2.2 Review of existing models
- 2.6.2.3 Model development
- 2.6.2.4 Boundary and initial conditions
- 2.6.2.5 Implementation of the coal resource development pathway
- 2.6.2.6 Parameterisation
- 2.6.2.7 Observations and predictions
- 2.6.2.8 Uncertainty analysis
- 2.6.2.9 Limitations
- Citation
- Currency of scientific results
- Acknowledgements
- Contributors to the Technical Programme
- About this technical product


