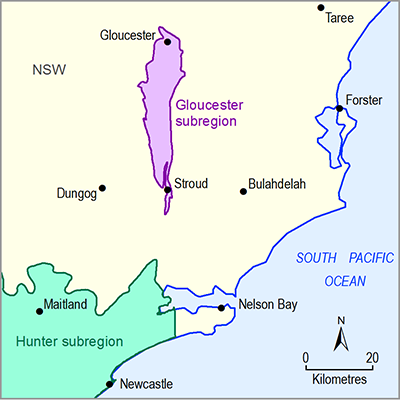
Daily streamflow data were obtained from NSW Office of Water. There are six streamflow gauges in the Gloucester subregion, details of which are summarised in Table 13. Gauges 209002 and 209003 are located in the southern part of the subregion; the other four are located in the northern part of the subregion. Three of the northern gauges (208020, 208028, and 208031) have less than 11 years of observation length. The rest have more than 40 years of observation length. All gauges show strong seasonal and inter-annual variability in streamflow (see Figures 28 to 31 in the companion product 1.1 for the Gloucester subregion (McVicar et al., 2014)).
Table 13 Gauge information for streamflow data for the Gloucester subregion
Data: Bureau of Meteorology (Dataset 1)
These daily streamflow time series are aggregated from instantaneous observations. Thus the quality of streamflow record depends on the quality of rating curves that were used to establish relationships between streamflow and stage.
Using the numerical quality codes that are part of the streamflow data records, the daily streamflow data were processed into unified six-class quality codes for each gauge (Zhang et al., 2013) (Table 14). The six unified quality categories are defined as follows:
- good: data are an accurate representation of streamflow
- fair: data are a moderately accurate representation of streamflow
- poor: data are a poor representation of streamflow and may be unsuitable for some quantitative applications
- unverified: data quality is not known
- non-conforming: data are unsuitable for most applications requiring quantitative analysis, but may contain useful qualitative information
- missing: data are missing or unusable.
The streamflow data flagged as good, fair, poor and unverified were kept while the flow data flagged as non-conforming were excluded. The non-conforming and missing streamflow data are both labelled in the data set as –9999.
Table 14 Quality codes for the NSW gauges for the Gloucester subregion
|
Numerical codes |
Description |
|---|---|
|
<17, 30, 32–34, 36–39, 94 |
Good |
|
17, 31, 40–46, 57–58, 82, 95 |
Fair |
|
26, 51, 54, 60–75, 80, 91, 100, 140 |
Poor |
|
130 |
Unverified |
|
35, 52, 77, 152 |
Non-conforming |
|
153–255 |
Missing |
Data: Bureau of Meteorology (Dataset 1)
Table 15 summarises the percentage of each quality code for each streamflow gauge. No streamflow gauges have non-conforming data. Most of the data falls into the categories of ‘good’, ‘fair’ and ‘unverified’. The amount of missing data for all catchments accounts for less than 4%.
Table 15 Percentage of water quality category accounting for the Gloucester subregion
Data: Bureau of Meteorology (Dataset 1)
There is no long-term water quality monitoring programme in the Gloucester river basin. Most of water quality observations have been conducted on the Avon River and Mammy Johnsons River, reported in Section 1.5.2.1 of companion product 1.5 for the Gloucester subregion (Rachakonda et al., 2015).

Product Finalisation date
- 2.1.1 Geography
- 2.1.2 Geology
- 2.1.3 Hydrogeology and groundwater quality
- 2.1.4 Surface water hydrology and water quality
- 2.1.5 Surface water – groundwater interactions
- 2.1.6 Water management for coal resource developments
- Citation
- Acknowledgements
- Currency of scientific results
- Contributors to the Technical Programme
- About this technical product
