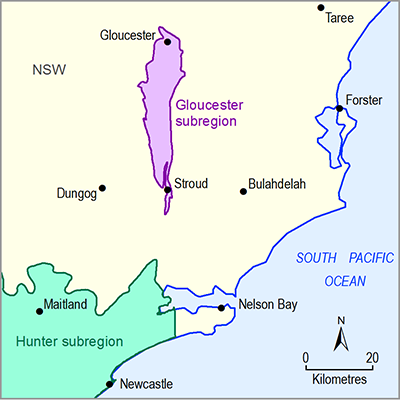
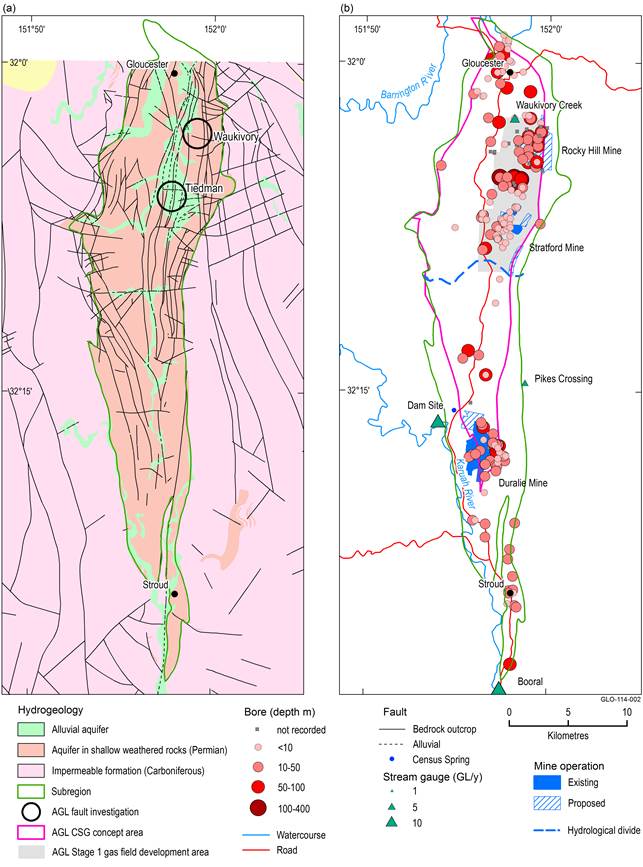
Most of the data required for groundwater modelling are obtained from bore data. Bore data for the Gloucester subregion were obtained from the Bureau of Meteorology, but originated from NSW state groundwater databases. The data acquired extends to November 2013. Not all model parameters are available at all bore locations. Table 5 lists the datasets that have been used to obtain hydrogeological data for the Gloucester subregion. Figure 14 shows the distribution of bores within the Gloucester subregion.
Table 5 Groundwater datasets used for hydrogeology and water quality analysis in the Gloucester subregion
|
Observed data |
Dataset |
Data item namea |
|
Bore construction |
NSW Office of Water – National Groundwater Information System 20140701 (NSW Office of Water, Dataset 1) |
Bore Construction Line NGIS_v2_20140701 |
|---|---|---|
|
NSW allocation of aquifer for screened unit of monitoring bores (Bureau of Meteorology, Dataset 2) |
Aquifers_assignment_JS_Jan13 |
|
|
Groundwater level |
HYDMEAS – Hydstra Groundwater Measurement Update_NoW_Nov2013 (NSW Office of Water, Dataset 3) |
HYDMEAS |
|
Hydraulic parameters |
State Transmissivity Estimates for Hydrogeology Cross-Cutting Project (Geoscience Australia, Dataset 4) |
NSW_Pump_Test_Data_WRON_Nov2013_consolidated |
|
tguess_NSW_full_set |
||
|
Groundwater quality |
HYDMEAS – Hydstra Groundwater Measurement Update_NoW_Nov2013 (NSW Office of Water, Dataset 5) |
ALL WQ IN SELECTED REGION_gw_28112013 |
|
Allocation |
Gloucester Groundwater Usage Estimates v20150501 (Bioregional Assessment Programme, Dataset 6) |
GLO_GW_licenses_ExtractionVolumes_BoreDepths_20150501 |
aTypography is as used in the dataset.
Source: Figure 25 in companion product 1.1 for the Gloucester subregion (McVicar et al., 2014)
2.1.3.1.1 Groundwater levels
Groundwater levels for the Gloucester subregion were obtained from the NSW Office of Water (Dataset 3). Water levels in this dataset are expressed as depths below the ground surface (mBGL) (i.e. a positive value indicates a watertable below the ground). Ground level elevations are missing for many bores.
Table 6 summarises the bores by groundwater-bearing unit. Almost 90% of groundwater level records in the dataset are from bores located in alluvium, with the remaining in fractured rock aquifers. Records of groundwater level for bores in deep water-bearing aquifers are not available in the NSW state groundwater dataset (NSW Office of Water, Dataset 3). There are nine bores with unknown bore depths, however they have been recorded as zero mBGL in the NSW Office of Water groundwater level database (Dataset 3).
Table 6 Summary of water level records for bores in the Gloucester subregion
‘NA’ means data not available.
Data: NSW Office of Water (Dataset 3)
In the NSW groundwater bore datasets (NSW Office of Water, Dataset 3), 205 monitoring records over a period of 23 years (1980 to 2002) were available from 49 bores for the Gloucester subregion. Most bores (around 24) have a single monitoring record (Table 7), although 20 bores have more than 7 monitoring records. Useful further work could include extracting data about groundwater levels available in various reports for the Gloucester subregion and assigning this data to the hydrogeology units. Due to limited availability of yearly groundwater levels in the dataset (NSW Office of Water, Dataset 3) no spatial and temporal data trend analysis is performed. Mining companies and coal seam gas resource developers often collect water level data and more information may be available at locations across the Gloucester subregion than has been reported in Dataset 3 (NSW Office of Water groundwater).
Table 7 Summary of monitoring records for bores in the Gloucester subregion
|
Number of monitoring records |
Number of bores |
|
1 |
24 |
|
2 |
1 |
|
4 |
3 |
|
5 |
1 |
|
7 |
9 |
|
8 |
8 |
|
9 |
1 |
|
12 |
1 |
|
14 |
1 |
Data: NSW Office of Water (Dataset 3)
2.1.3.1.2 Hydraulic parameters
Hydraulic parameters provide critical input into the numerical groundwater model – the identification of uncertainties in the hydraulic parameter fields is essential as they can contribute significantly to the overall uncertainty associated with the modelling of impacts.
The NSW groundwater data (NSW Office of Water, Dataset 1, Dataset 3; Bioregional Assessment Programme, Dataset 7) contains limited pumping test data, which usually include the date and duration of the test, initial water level, pumping rate and maximum drawdown. Available hydrogeological data sources (e.g. university theses, consultancy reports and government reports) were examined and hydrogeological records (e.g. stratigraphy, water level, pumping test results) were incorporated into the datasets (Bureau of Meteorology, Dataset 2; Geoscience Australia, Dataset 4) where appropriate.
Transmissivity values were estimated from pumping test data using the TGUESS approach (a computerised technique for estimating the hydraulic conductivity of aquifers from specific capacity data; Bradbury and Rothschild, 1985). Hydraulic conductivity was computed from the derived transmissivity data where screen interval data were available (Geoscience Australia, Dataset 4). However, where hydraulic conductivity or transmissivity was available in the original state database, this value was kept as the primary value for the statistical analysis. When multiple hydraulic conductivity or transmissivity records were present, the mean was used for the statistical analysis. No pumping test records or storage values (Ss and ST) are available for the bores located in the Gloucester subregion in the NSW bore database (NSW Office of Water, Dataset 3). No transmissivity or storage values for the bores located in the Gloucester subregion are available in the Bureau of Meteorology (Dataset 2) and Geoscience Australia (Dataset 4) datasets.
Hydraulic conductivity values for the aquifers reported in various reports (Heritage Computing, 2009, 2012; Parsons Brinckerhoff, 2013; SRK, 2010) are reproduced in Table 8.
Table 8 Range of hydraulic conductivity data for bores in the Gloucester subregion as reported in various reports
|
Groundwater-bearing unit |
Hydraulic conductivity range (m/day) |
|---|---|
|
Alluvium |
0.3–500 |
|
Fractured Rock |
0.01–20 |
|
Deep water-bearing |
0.002–0.03 |
Source: Heritage Computing (2009, 2012); Parsons Brinckerhoff (2013); SRK (2010)
2.1.3.1.3 Groundwater quality
The observed water chemistry and quality data for the Gloucester subregion are sourced primarily from the NSW state groundwater dataset (NSW Office of Water, Dataset 5). It contains 1015 water chemistry sampling records from 32 groundwater bores across the Gloucester subregion. As the aquifers in which the bores in this dataset are screened are not available for any bores, the attribution to aquifer (Table 9) is based on the depth of the bore and the thickness of aquifer recorded in the various hydrogeological reports for the Gloucester geological basin. Mining companies and coal seam gas resource developers often collect water quality data and more information may be available at locations across the Gloucester subregion than has been reported in Dataset 5 (NSW Office of Water).
Table 9 Number of water chemistry records for the Gloucester subregion
|
Groundwater-bearing unit |
Number of bores |
No of water chemistry records |
|---|---|---|
|
Alluvium |
21 |
621 |
|
Fractured Rock |
11 |
394 |
Data: Bioregional Assessment Programme (Dataset 6)
A summary of groundwater chemistry results for the bores in the NSW groundwater dataset (NSW Office of Water, Dataset 5) is provided in Table 10. Further information about the analysis of water chemistry in the Gloucester subregion is available in Section 1.5.2.2 of companion product 1.5 for the Gloucester subregion (Rachakonda et al., 2015).
Table 10 Summary of water chemistry results for the Gloucester subregion
Data: NSW Office of Water (Dataset 5)
2.1.3.1.4 Allocation
The allocation data are summarised in Table 11. Most of the licensed allocation is from alluvial aquifers, with a lesser volume from fractured rock aquifers. There is no licensed allocation to extract water from the deep water-bearing units.
An industrial report prepared by Parsons Brinckerhoff (2013) reported that annual stock and domestic bore use is approximately 1 ML/bore. Australasian Groundwater and Environmental (2013) has reported that a single groundwater facility exists (irrigation bore) in the Avon River management area with an annual entitlement of 20 ML/year from the alluvium. Further information about the analysis of entitlements and/or allocations in the Gloucester subregion is available in Section 1.5.1.2.1 of companion product 1.5 for the Gloucester subregion (Rachakonda et al., 2015).
Table 11 Summary of allocation data for the bores in the Gloucester subregion
Data: Bioregional Assessment Programme (Dataset 6)

Product Finalisation date
- 2.1.1 Geography
- 2.1.2 Geology
- 2.1.3 Hydrogeology and groundwater quality
- 2.1.4 Surface water hydrology and water quality
- 2.1.5 Surface water – groundwater interactions
- 2.1.6 Water management for coal resource developments
- Citation
- Acknowledgements
- Currency of scientific results
- Contributors to the Technical Programme
- About this technical product

