2.1.1.3.1 Increasing density of meteorological observations
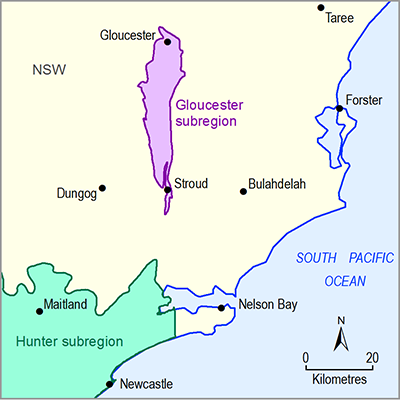
The characterisation of input data errors in Section 2.1.1.2 suggests that having a denser network of official Bureau of Meteorology stations recording precipitation is essential for improved water-related modelling in the Gloucester subregion. With the number of stations observing daily P declining across all of Australia – from approximately 7500 in the 1970s to approximately 6500 in the late 2000s (Jones et al., 2009, Figure 1a) – there has been an associated decrease in the level of predictability of P (Jones et al., 2009, Figure 9). The observational network needs to be located to better capture the influence of local relative relief in the Gloucester subregion and surrounds. For example, locating stations to the east of the subregion, the direction from which the prevailing sea breezes bring moisture laden air which often becomes precipitation due to orographic processes, will allow better observation of this process. The importance of small changes in elevation on precipitation rates should not be underestimated. For example, for a flat area of Norway in the 1950s (with approximately 50 m elevation difference) more than 200 rain gauges were installed in an area of about 30 km2 and it was found that precipitation rates on the small hills could be double those on the adjacent lower areas (Bergeron, 1960; Roe, 2005).
2.1.1.3.2 Recent observed declining wind speeds
Future climate projections produced by GCMs are uncertain (Lim and Roderick, 2009; Sun et al., 2011) and use of historically repeated PET values (calculated using the physically-based Penman’s formulation of PET) means that the impact of declining rates of observed wind speed which are offsetting increasing air temperature enhancement of PET (Donohue et al., 2010; McVicar et al., 2012a; McVicar et al., 2012b) are not included in the resultant calculations. In ‘equitant’ areas like the Gloucester subregion, where actual evapotranspiration is at times water-limited and at other times energy-limited through the year (McVicar et al., 2012b), estimates of both P and PET are important for future projections.
2.1.1.3.3 Impacts of increasing CO2 concentrations on future streamflow
Finally, the impact of rising atmospheric concentrations of CO2 on vegetation water use, which likely means increasing streamflow generation in energy-limited areas (Betts et al., 2007; McVicar et al., 2010) and decreasing streamflow generation in water-limited areas (McVicar et al., 2010; Ukkola et al., 2015), needs to be incorporated for long-term hydrological modelling. In energy-limited areas the impact of vegetation water use efficiency (WUE; essentially a measure of CO2 assimilation per a measure of H2O transpiration) is altered by atmospheric concentrations of CO2 and this directly increases streamflow generation (Betts et al., 2007; McVicar et al., 2010); this is a positive feedback. In water-limited areas, CO2 driven vegetation enhancement (Donohue et al., 2013) is likely to offset the WUE changes, and likely result in greater vegetation water-use and indirectly reduce streamflow generation (McVicar et al., 2010; Ukkola et al., 2015); this is a negative feedback. An increase of 1 ppm of CO2 roughly equates to an increase of 1 mm of H2O available to vegetation (even though there has been no change in P; Farquhar, 1997); over the long-term this may have profound implications on catchment water balances, and the feedbacks with vegetation. For example, if modelling out to 2100 with a current atmospheric CO2 concentration of approximately 400 ppm (which is increasing at about 2 ppm per year so by 2100 atmospheric CO2 will be about 600 ppm) this 50% increase on its current value will not be accounted for. The atmospheric CO2 increase is already having long-term impacts on vegetation dynamics (Donohue et al., 2013) and catchment water balances (Betts et al., 2007; McVicar et al., 2010; Ukkola et al., 2015).

Product Finalisation date
- 2.1.1 Geography
- 2.1.2 Geology
- 2.1.3 Hydrogeology and groundwater quality
- 2.1.4 Surface water hydrology and water quality
- 2.1.5 Surface water – groundwater interactions
- 2.1.6 Water management for coal resource developments
- Citation
- Acknowledgements
- Currency of scientific results
- Contributors to the Technical Programme
- About this technical product
