The Sydney Basin bioregion includes all or parts of six major river basins or river regions. These are the Hawkesbury River, Shoalhaven River, Sydney Coast-Georges River, Clyde River-Jervis Bay, Wollongong Coast and Macquarie-Bogan river systems. Except for the Macquarie-Bogan river basin, these rivers drain from the Great Dividing Range to the NSW coastline (Figure 10 in Section 1.1 .2).
1.1.5.1.1 Surface drainage networks
The Hawkesbury river basin dominates the subregion with 16,050 km2 of its 22,000 km2 basin within the bioregion (65% of the bioregion area) (Table 14). The main southern tributaries of the Hawkesbury River are the Nepean, Wollondilly and Coxs rivers, which are important water supply catchments to Sydney. The Wollondilly River joins with the Coxs River at Lake Burragorang and then continues as the Warragamba River until it meets the Nepean River. Much of the headwaters of the Wollondilly River are outside the bioregion. The Nepean River rises in the Southern Highlands, near Robertson, and flows northwards through the Nepean Dam until it meets the Grose River and becomes the Hawkesbury River. The Nepean River is fed from a number of westerly flowing tributaries, including the Avon, Cordeaux and Cataract rivers. The Hawkesbury River’s main northern tributaries, the Colo and the Macdonald rivers, rise in the Great Dividing Range to the west and the Hunter Range to the north and flow towards the east and south to meet the Hawkesbury River. Most of their catchments are within national parks and the rivers are unregulated and valued for their wilderness values. The Hawkesbury River becomes tidal near the confluence of the Nepean River and Grose River, about 4 km upstream of Richmond (NSW Public Works, 1987). Table 15 summarises the basin areas and areas within the bioregion for the Hawkesbury’s main sub-basins. While the natural flow of many of the rivers and streams in the Hawkesbury-Nepean river basin has been altered by water storages, the system is considered unregulated because water is not captured and released into the river for extraction by downstream users (NSW Primary Industries Water, 2016).
The Shoalhaven river basin rises in the Gourock and Minuma ranges, outside and to the south of the bioregion. It flows in a northerly direction, receiving inflows from Sallee Creek, Budlong Creek and Kangaroo River. Total catchment area is about 7200 km2, of which just over 2900 km2 is in the bioregion (Table 14). It is an important source of drinking water to Greater Sydney and the Southern Highlands
The Sydney Coast-Georges River and Wollongong Coast basins are relatively small. The Georges, Woronora and Hacking rivers are the main Sydney catchments; the Minnamurra River and Macquarie Rivulet dominate the Wollongong Coast. These coastal basins are located entirely within the bioregion and cover an area of 2536 km2. The Clyde River-Jervis Bay coastal basins lie in the south of the bioregion and are bounded to the west by the Shoalhaven river basin.
The Sydney Basin bioregion includes a small area of the Cudgegong and Turon river basins, which are tributaries of the Macquarie-Bogan river basin within the Murray-Darling Basin. These rivers rise in the north-west, behind the Capertee and Wolgan rivers (in the Colo river basin) and flow westward, away from the Sydney Basin bioregion. This westward draining part of the bioregion represents 6% of the bioregion’s total area (Table 14).
Table 14 Major river basins in the Sydney Basin bioregion
Data: Bureau of Meteorology (Dataset 1)
Table 15 Sub-basins of the Hawkesbury river basin
Data: Bureau of Meteorology (Dataset 1)
1.1.5.1.2 Surface water infrastructure
There are 18 major dams (storage capacity >1 GL) within the Sydney Basin bioregion, many of them constructed to ensure a secure supply of water to the Sydney and Wollongong urban centres. Table 16 lists these storages, their storage capacities and managing authorities. The Blue Mountains entry comprises five storages, only one of which (Upper Cascade) has a capacity greater than 1 GL; the capacity in Table 16 is the total for all five storages. The locations of the storages are shown in Figure 37.
Through an interconnected system of dams, river channels, pipelines, canals, weirs and pumping stations, water from the Coxs, Wollondilly, Nepean, Wingecarribee, Kangaroo and Shoalhaven rivers is made available to Greater Sydney’s water supply system. This water supply system, managed by WaterNSW (formerly Sydney Catchment Authority and State Water Corporation), services more than 4.5 million people in Sydney, Wollongong, Blue Mountains, Shoalhaven, Goulburn and Southern Highlands regions. It comprises five subsystems: Warragamba; Upper Nepean; Shoalhaven; Woronora and Blue Mountains. Despite the level of water resource development, this is not considered a regulated system.
Lake Burragorang, which was formed by the construction of Warragamba Dam and extends back into the Coxs and Wollondilly river valleys, is Sydney’s largest water supply. At 2031 GL, it accounts for over 70% of the bioregion’s storage capacity and stores about 80% of Sydney’s water. Water flows under gravity through two pipelines to Prospect Filtration Plant from where it is distributed to Sydney, Penrith and the lower Blue Mountains.
Table 16 Major storages, managing authorities and storage capacities (ML) in the Sydney Basin bioregion
aCapacity includes dead storage, which is the volume of water below the lowest offtake point.
Data: Bureau of Meteorology (2015)
The ten other major storages operated by WaterNSW account for a further 26% of the bioregion’s water storage capacity. Lakes Avon, Cataract and Cordeaux on tributaries of the Nepean River are the largest of these and together with Lake Nepean are the storages making up the Upper Nepean water supply system. The Avon storage supplies the Wollongong area via the Illawarra Filtration Plant. The Upper Nepean System also supplies Camden, Campbelltown and Wollondilly areas. A tunnel between the Avon and Nepean dams allows water to be moved from the Shoalhaven system to the Illawarra region. The Shoalhaven system supplies the Southern Highlands and Goulburn from Wingecarribee Reservoir and can top up Sydney and Illawarra water supplies via the Wingecarribee River which flows into Lake Burragorang or via the Glenquarry Cut canals and pipelines into the Nepean Dam.
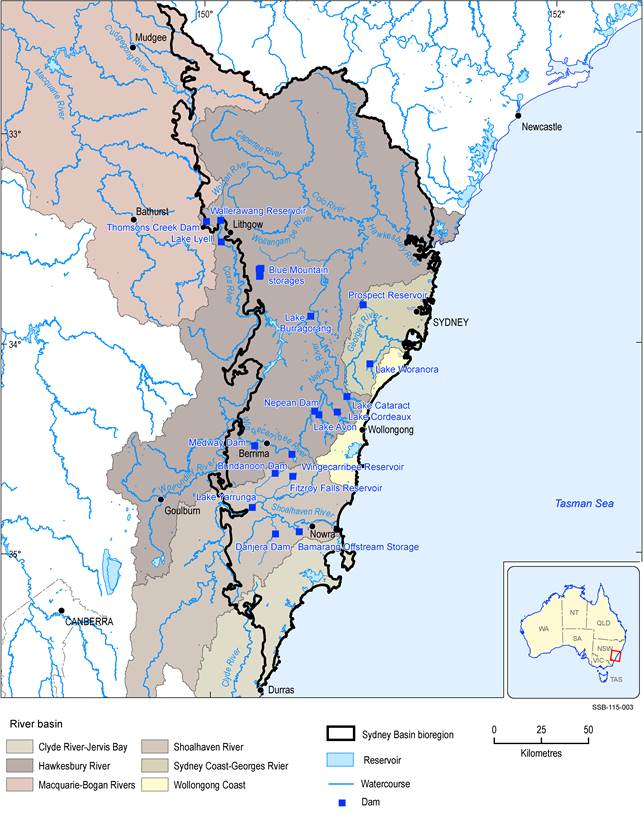
Figure 37 Major water storages (>1 GL capacity) in the Sydney Basin bioregion
Data: Bioregional Assessment Programme (Dataset 2)
The Woronora water supply is not integrated with the other parts of the Greater Sydney water supply system. The dam holds water from the Woronora River and supplies residents of southern Sydney and northern Wollongong. Similarly, the Blue Mountains water supply system is a discrete system that captures water from Blue Mountains catchments to supply the upper and middle Blue Mountains. It can be supplemented with water from Oberon Dam, outside the region, via a pipeline from the Fish River scheme.
The Fish River water supply scheme transfers western flowing water east of the Great Dividing Range to supply water to Lithgow for domestic and industrial uses and also supplements town water supplies in the Blue Mountains.
A number of smaller storages – Danjera, Bamerang, Medway and Bundanoon – supplement water supplies to Nowra and Southern Highland towns.
1.1.5.1.3 Flooding history
The Hawkesbury-Nepean floodplain extends from just downstream of Warragamba Dam, near Wallacia to Sackville and includes the urban areas of Penrith, Windsor and Richmond in western Sydney. The floodplain is downstream of a vast catchment, with many major rivers delivering water into the Hawkesbury River. The area is vulnerable to floods because the Hawkesbury River channel is forced to narrow as it enters Sackville Gorge between Windsor and Wisemans Ferry. During high flows, water cannot funnel into the gorge quickly enough and instead backs up and spills onto the floodplain. There have been numerous serious floods on the Hawkesbury-Nepean floodplain since European settlement. The highest recorded flood occurred in 1867 when the river height at Windsor reached 19.2 mAHD. It was also the worst flood in terms of loss of life and destruction of property and livestock. The next most major floods occurred in 1961 and 1964 when peak heights of 15.09 and 14.4 mAHD, respectively, were recorded at Windsor. Since then there were floods in 1978, 1988 and 1990 (NSW State Emergency Service, 2015a).
Flood frequency analysis reported in the Hawkesbury Nepean Flood Emergency Sub Plan (NSW State Emergency Service, 2015a) estimates that the 1867 flood was a one in 250-year event, while the 1961 flood was a one in 40-year event. The more recent floods of 1988 and 1990 were between one in 10 and one in 20-year events. The probable maximum flood (PMF) for the Hawkesbury-Nepean, assuming full storage at Warragamba Dam (Lake Burragorang), a fully saturated catchment and around 790 mm of rainfall across the Lake Burragorang catchment over a 72-hour period, has been estimated to be a one in 100,000-year event. The 1867 was equivalent to 40% of the volume of water in a PMF and the 1967 had about 24% of the volume of water in a PMF.
Record floods were recorded in the Nepean River in 1873 (16.54 m at Camden; 20.62 m at Wallacia) and in 1964 (17.88 m at Menangle). On the Georges River at Liverpool, the highest recorded flood was 7.53 m in 1897. In 1988, the Georges River at Milperra recorded its highest flood (NSW State Emergency Service, 2015b).
1.1.5.1.4 Periods of dry
Significant dry spells and periods of drought have affected streamflows in the bioregion. In Figure 38, streamflow variability is summarised for three gauging stations across the bioregion using a difference from mean analysis (Bureau of Meteorology, 2016). Below-average flows were recorded at each site for at least a five-year period around the early 1980s and for a longer period (at least 15 years) from about 1994.
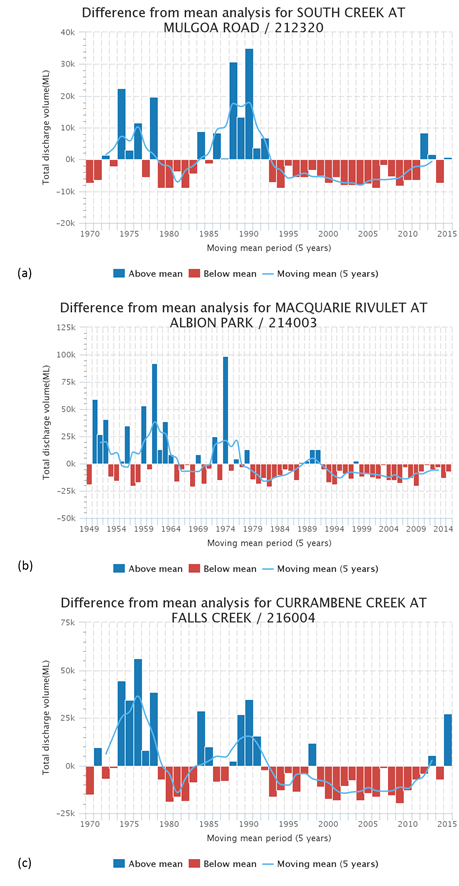
Source: Bureau of Meteorology (2016)
In intermittent streams, where streamflow is characterised by a variable connection between groundwater and streamflow in response to fluctuating watertable depth, prolonged periods of low rainfall can cause a shift to longer periods and/or more extensive areas of no flow along a stream channel, as the watertable drops below the depth of the channel bed. The flow duration curves in Figure 39 illustrate this variability for an intermittent stream in the bioregion, South Creek at Mulgoa Road (212320). Over the 45 years of record, flow has been recorded about 70% of the time. On average, the stream flowed more continuously between 1970 and 2000 (>80% of the time) than it has in the 15 years since then. Between 2000 and 2009 when much of south‑eastern Australia was experiencing a prolonged drought, the gauge recorded no flow for around 45% of that time.
If dry conditions become increasingly severe, even predominantly perennial streams may experience disconnections, varying from localised, relatively short duration disconnections to longer, more extensive occurrences of no flow. Figure 40 shows flow duration curves for a perennial stream. The long flat tail indicates that a continuous low flow is sustained throughout the year and that the connection to groundwater persists even during extended dry periods. In the period since 2010, flows have been on average lower across the entire flow regime than the long‑term average for this gauging station (about 65 years of record).
Changes in low flows due to mining-induced groundwater drawdown could lead to longer periods of no flow days and/or longer stretches of river that cease to flow than occur under pre-disturbance conditions.
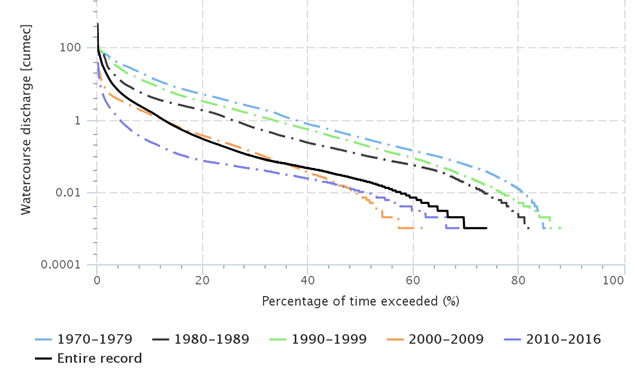
Source: Bureau of Meteorology (2016)
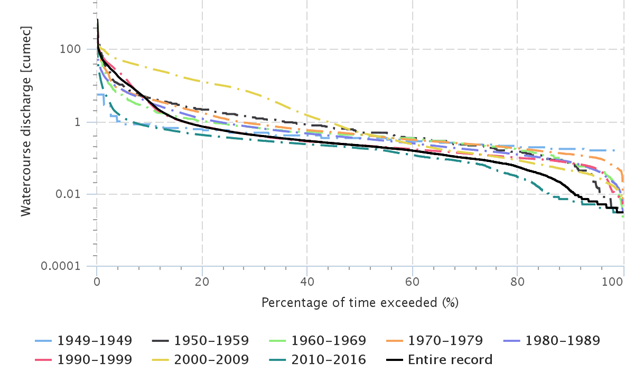
Source: Bureau of Meteorology (2016)
