Various regionalisations are referred to in this context statement, including (i) local land services (LLS) regions (NSW Government, 2014), (ii) Interim Biogeographic Regionalisation for Australia (IBRA) bioregions and subregions (SEWPaC, 2012) and (iii) NSW local government areas (LGAs) (Australian Bureau of Statistics, 2011). Their relationships with the Sydney Basin bioregion are summarised below.
The Sydney Basin bioregion contains parts of four LLS regions (Table 3 and Figure 5). LLSs provide agricultural, biosecurity, natural resources management and emergency management services to regional NSW. About 43% and 30% of the Sydney Basin bioregion lie within the Greater Sydney and South East LLS regions, respectively. Smaller proportions of the bioregion lie within the Hunter and Central Tablelands LLS regions in the north and north-west (Table 3 and Figure 5).
Table 3 Local land services regions contained in the Sydney Basin bioregion
These data are listed in descending order based on their area in the Sydney Basin bioregion.
aLocal land services region
Data: Local Land Services, Trade and Investment NSW (Dataset 4)
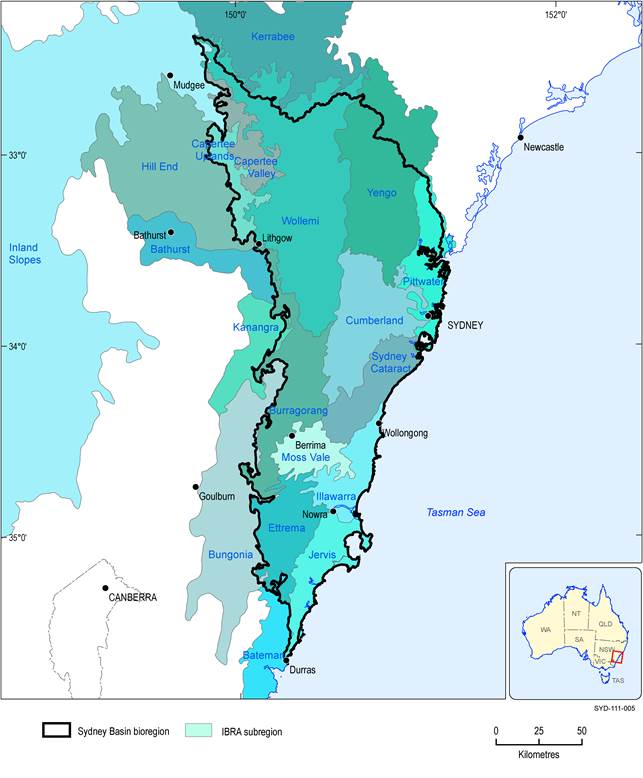
The Sydney Basin bioregion aligns closely with the Sydney Basin IBRA bioregion (SEWPaC, 2012), but also includes parts of the NSW South Western Slopes and South Eastern Highlands IBRA bioregions. The IBRA bioregions are large, geographically distinct areas of land with common characteristics, such as climate, geology, landforms and ecosystems. The IBRA bioregions are further refined into subregions which are more localised and geomorphologically uniform. The (BA-defined) Sydney Basin bioregion contains all or parts of 18 IBRA subregions (Figure 6 and Table 4), although four of these along the western edge of the Sydney Basin bioregion intersect only slightly (i.e. <2%) and are likely an artefact of the mapping. In Table 4, they are identified and commented on in caption note (b). Nine IBRA subregions are almost wholly contained (i.e. >95%) within the Sydney Basin bioregion. The most significant in terms of areal extent are the Wollemi, Yengo, Cumberland and Burragorang IBRA subregions which cover just over 58% of the Sydney Basin bioregion. The names and spatial extents for the IBRA subregions contained within the Sydney Basin bioregion are provided in Table 4. Key characteristics of the main IBRA subregions contained in the Sydney Basin bioregion can be found in the geography (Section 1.1 .2) and ecology (Section 1.1 .7) sections of this context statement.
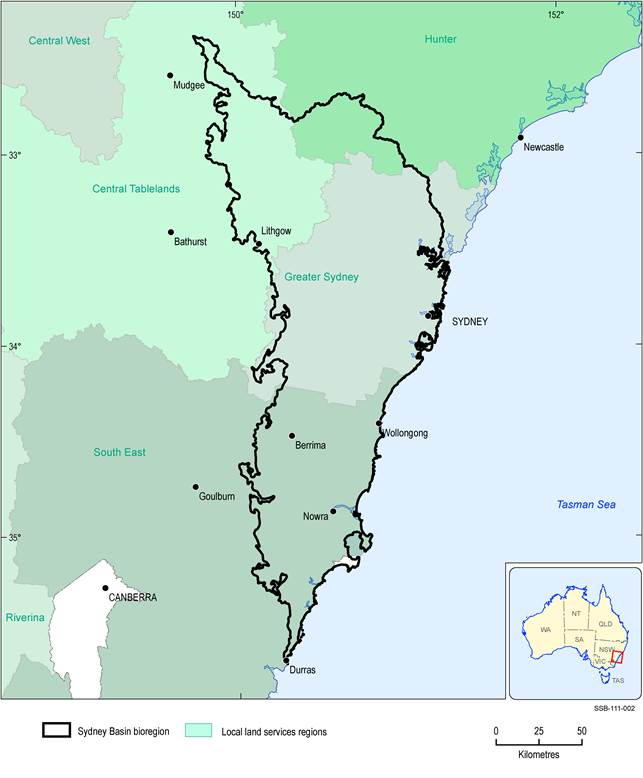
Figure 5 Local land services regions relative to the Sydney Basin bioregion
Data: Local Land Services, Trade and Investment NSW (Dataset 4)
Data: Department of Sustainability, Environment, Water, Population and Communities (Dataset 5)
Table 4 Interim Biogeographic Regionalisation for Australia (IBRA) subregions contained within the Sydney Basin bioregion
These data are listed in descending order based on their area in the Sydney Basin bioregion.
aInterim Biogeographic Regionalisation for Australia subregion
binclusion of this IBRA subregion could be an artefact of mapped boundaries.
Data: Department of Sustainability, Environment, Water, Population and Communities (Dataset 5)
As at May 2015, the Sydney Basin bioregion contained all or parts of 54 NSW LGAs (Australian Bureau of Statistics, 2011) (Figure 7 and Table 5). The high number of LGAs reflects the high population density within the Sydney metropolitan area, which has 33 LGAs (listed in Figure 7). The largest LGAs (>1000 km2) are the non-Sydney metropolitan areas of Shoalhaven, Lithgow, Hawkesbury, Wingecarribee, Wollondilly, Singleton, Mid-Western Region and Blue Mountains. Sydney metropolitan LGAs vary in size from around 6 km2 (Hunters Hill LGA) to 460 km2 (Hornsby LGA).
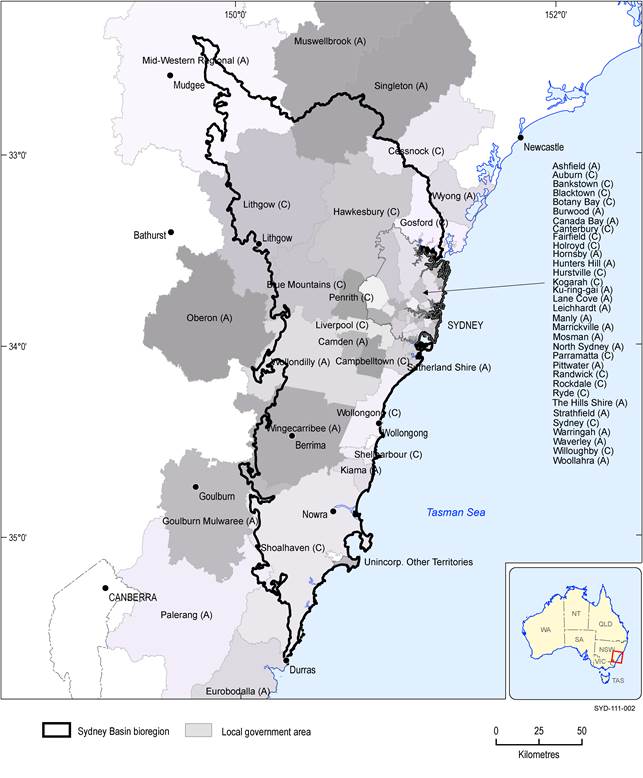
Figure 7 Local government areas relative to the Sydney Basin bioregion
Data: Australian Bureau of Statistics (Dataset 6)
Table 5 Local government areas (LGAs) contained within the Sydney Basin bioregion
These data are listed in descending order based on their area in the Sydney Basin bioregion.
aLGA names are as they appear in the database – (A) = area (i.e. shire) council; (C) = city council
bincludes LGAs of: Ashfield, Auburn, Bankstown, Blacktown, Botany Bay, Burwood, Canada Bay, Canterbury, Fairfield, Holroyd, Hornsby, Hunters Hill, Hurstville, Kogarah, Ku-ring-gai, Lane Cove, Leichhardt, Manly, Marrickville, Mosman, North Sydney, Parramatta, Pittwater, Randwick, Rockdale, Ryde, The Hills Shire, Strathfield, Sydney, Warringah, Waverley, Willoughby, Woollahra
Data: Australian Bureau of Statistics (Dataset 6)
