The Sydney Basin bioregion has a temperate climate, which means that temperatures are on average relatively moderate and not characterised by extremes of hot and cold or dramatic changes between summer and winter. The mean monthly temperatures for June, July and August are below 10 °C and for December to February are around 20 °C, but parts of the region are characterised by hot summers, particularly along the coast and at lower elevations, grading to warm summers at higher elevations.
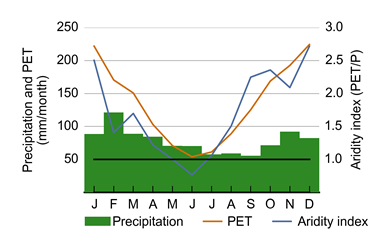
The bioregion does not have a dry season, but the temporal pattern indicates summer dominant rainfall with December to March averaging 90 to 120 mm/month, while July to October averages about 60 mm/month (Figure 18). The long-term (1900 to 2012) mean precipitation (P) is 951 mm/year but, as for much of Australia, there is considerable inter-annual variability (Figure 19). The maximum annual P over this period was 2000 mm in 1950, while 1944 recorded a minimum of 400 mm/year over this period. Figure 19 highlights longer term trends within the record, such as a relatively dry period between 1900 and 1949 when mean annual P was less than 900 mm/year and there was only one year when the annual total exceeded 1200 mm, followed by a generally wetter period through to the 1990s when mean P exceeded 1000 mm/year and there were 16 years with annual totals at and above 1200 mm.
Data: Bioregional Assessment Programme (Dataset 16)
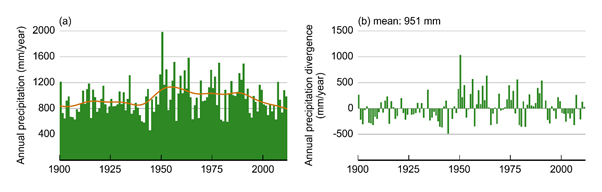
Figure 19 Temporal characteristics of annual precipitation for the Sydney Basin bioregion
(a) bioregion-averaged annual precipitation with smoothed rolling average (orange line) and (b) annual precipitation divergence from the long-term (1900 to 2012)
Data: Bioregional Assessment Programme (Dataset 16)
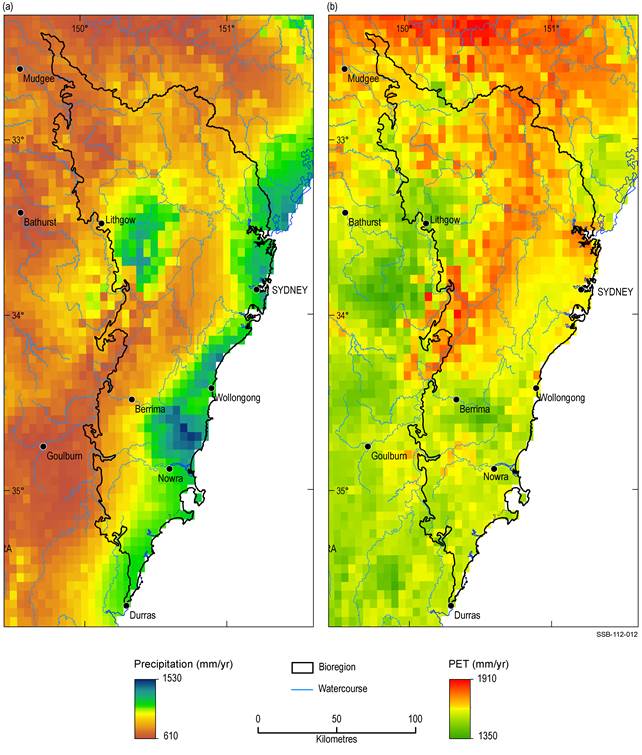
The spatial distribution of rainfall varies significantly, with rainfall generally decreasing with distance from the coast, but increasing with elevation. Figure 20a highlights the higher rainfall areas along the coast and in the upland areas associated with the Blue Mountains and the Southern Highlands between Wollongong, Nowra and Berrima. Mean annual P varies from 610 mm/year in the north-west of the region to 1530 mm to the north of Nowra.
Potential evapotranspiration (PET), which is a measure of the atmosphere’s ‘drying power’, is a function of surface and air temperatures, radiation and wind. The PET data presented here have been calculated using the approach of Donohue et al. (2010) based on the Penman formulation, using meteorological data from the Bureau of Meteorology (Jones et al., 2009) and daily mean wind speed from CSIRO (McVicar et al., 2008). PET exhibits a strongly seasonal pattern with winters characterised by low evaporative demand and summers by high evaporative demand. For the Sydney Basin bioregion, mean annual PET exceeds 200 mm/month from December to February, but is in the range of 50 to 70 mm/month through June, July and August (Figure 18). For most of the year, P is below PET. The aridity index, which is calculated as PET/P, provides an indication of the limiting condition on actual evapotranspiration (AET). When the aridity index is greater than 1.0, as it is on average for 9 to 10 months in the bioregion, the availability of water places a limit on AET; when the aridity index is below 1.0, as it is on average from May to July in the bioregion, AET is energy-limited (Figure 18).
As for P, the spatial pattern of potential evapotranspiration (Figure 20b) is variable across the bioregion, but with a contrasting pattern to P (Figure 20a). The lower rainfall areas are associated with higher PET, reflecting generally warmer temperatures and less cloud cover. The higher rainfall areas are on average cloudier and cooler and therefore associated with lower evaporative demand.
Data: Bioregional Assessment Programme (Dataset 17)
Figure 21 shows the inter and intra-variability in monthly P, PET and the climate factors (primarily air temperature, vapour pressure deficit (VPD), net radiation and wind speed) that govern PET for the 30 years from 1982 to 2012. While there is on average relatively low variability in P between months, in any given month, there is marked variability in monthly totals over the 30‑year period (Figure 21a). Wind speed shows a strong seasonal signal, with a lot of intra-month variability. Other climate variables also show marked seasonal variability, but little variation between years in any given month.
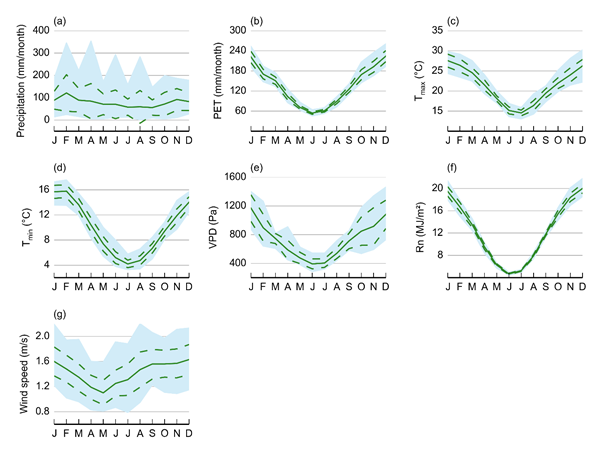
Figure 21 Monthly climate variables for the Sydney Basin bioregion
Charts show: (a) precipitation (P), (b) potential evapotranspiration (PET), (c) maximum temperature (Tmax), (d) minimum temperature (Tmin), (e) vapour pressure deficit (VPD), (f) net radiation (Rn), and (g) wind speed for the Sydney Basin bioregion. The mean (solid line), ± 1 standard deviation (dashed lines) and the minimum to maximum range (blue shaded area) are shown. Values were calculated over the years 1982 to 2012 (inclusive)
Data: Bioregional Assessment Programme (Dataset 16)
Monthly trends of P, PET and the other variables that drive PET are shown in Figure 22. The monthly trends for P straddle the no trend (i.e. zero mm/month/year) line, whereas PET, even in the face of warming air temperatures is mainly declining. Declining rates of PET are due to declining rates of wind speed (in all months) and declining amounts of net radiation and VPD (in most months), which together result in a larger change than the PET increases associated solely with increasing air temperature. Similar findings were reported for other areas of south-east of Australia (Donohue et al., 2010, 2011; McVicar et al., 2012a).
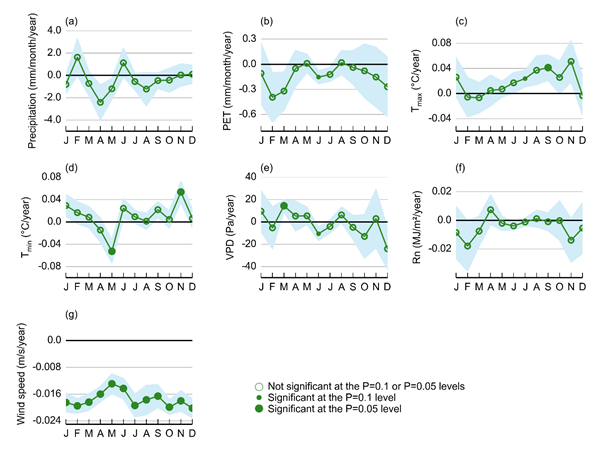
Charts show: (a) precipitation (P), (b) potential evapotranspiration (PET), (c) maximum temperature (Tmax), (d) minimum temperature (Tmin), (e) vapour pressure deficit (VPD), (f) net radiation (Rn), and (g) wind speed for the Sydney Basin bioregion. The trend (line), ± 1 standard error (blue shaded area) and trend significance (markers) are shown. Values were calculated over the years 1982 to 2012 (inclusive). Trends are obtained from ordinary linear regression (a parametric test) of the monthly time series and significance was calculated using 2-sided T-test (another parametric test)
Data: Bioregional Assessment Programme (Dataset 16)
Using 15 global climate models (GCMs) from the Fourth Assessment Report of the Intergovernmental Panel on Climate Change (IPCC, 2007, hereafter referred to as IPCC AR4), Post et al. (2012) used the IPCC A1B global warming scenario output to transform historical daily climate records into future daily climate projections of P and PET for use in rainfall-runoff models. Under the IPCC A1B scenario, the mean global temperature is predicted to rise by 1 °C by 2030 and 2 °C by 2070, relative to the global mean temperature in 1990. This scenario is based upon (i) very rapid economic growth, (ii) with global populations peaking mid-century and declining thereafter, and (iii) the rapid introduction of new and more efficient technologies with a balance across all energy sources (IPCC, 2007). Full details of the transformation of historical daily climate records using IPCC AR4 output are reported in Chiew et al. (2009) and Li et al. (2009).
Post et al. (2012) assessed the changes in P from the 15 GCMs and reported changes for large river basins including the Hawkesbury, Shoalhaven, Sydney Coast-St Georges River, Wollongong Coast and Clyde River-Jervis Bay and Macquarie-Castlereagh river basins, which make up the Sydney Basin bioregion (see Figure 37 in Section 1. 1.5). Table 9 shows that for all river basins, between 9 and 11 of the GCMs selected predict some decline in P. Taking into account the range of projections that may occur for a 1 °C rise in temperatures (associated with 2030), there is approximately a –7%, –2% and 4% change in P projected for the dry extreme, median and wet extreme, respectively. For a 2 °C rise in temperatures (associated with 2070), these values are approximately –15%, –5% and 8%, respectively (Table 9).
Table 9 Summary of projected impacts of climate change on rainfall for the broad vicinity of the Sydney Basin bioregion
Data: Table 2 in Post et al. (2012)
To model future runoff (Q), Post et al. (2012) used the future projections of daily P, along with a form of PET (specifically Morton’s wet environment areal formulation) as input to a lumped conceptual rainfall-runoff model called SIMHYD which utilises the Muskingum routing method (Chiew et al., 2009). The Post et al. (2012) modelling results suggest for a 1 °C rise in temperatures (associated with 2030) there is potentially a –20%, –6% and 8% change in Q projected for the dry extreme, median and wet extreme, respectively (Table 10). For a 2 °C rise in temperatures (associated with 2070), these values are approximately –32%, –11% and 16%, respectively (Table 10). Estimates of both P and PET are important for future projections of Q (McVicar et al., 2012b). As Morton’s wet environment areal formulation of PET does not include wind speed in its formulation, the impact of declining rates of observed wind speed, which acts to offset the PET enhancement from increasing air temperature (Donohue et al., 2010; McVicar et al., 2012a; McVicar et al., 2012b), is not factored into these estimates of runoff change.
Table 10 Summary of projected impacts of climate change on runoff for the broad vicinity of the Sydney Basin bioregion
Data: Table 3 in Post et al. (2012)
