All geographic data specific to the Namoi subregion were obtained from state or national datasets. Results of the analysis that characterises the errors of the subregion-specific input climate data for the water balance modelling are outlined in this section.
In addition to generating daily and monthly grids of meteorological variables (P, Tmax and Tmin), the Bureau of Meteorology (Jones et al., 2009) also generate daily and monthly RMSE grids of the same variables. These daily and monthly RMSE grids are a combined measure of the observational error and geostatistical error. The latter is a function of the interpolation method, density of observation stations and degree of spatial correlation of the process(es).
To characterise errors of the input climate data, the long-term (from January 1980 to December 2009) monthly mean values for P, Tmax and Tmin were calculated. Also calculated were the long‑term monthly RMSE values for the same variables for the same time period. Relative error, expressed as a percentage, was calculated by dividing the monthly RMSE grid by the monthly mean grids (i.e. RMSE grid/mean grid for each meteorological variable).
The spatially-averaged long-term monthly mean P for the Namoi subregion is 60 mm/month, and the associated RMSE mean for the subregion is 29 mm/month (see Figure 3a and Figure 3b, respectively). This results in a relative error of 56% in the input P grids (Figure 3c). The high relative error is due, in part, to P being a highly spatially variable process. Relative error tends to be lower around the larger inland towns, reflecting the denser network of rainfall gauges, and higher in the less populous areas. The mean RMSE value based on the whole catchment may not represent error in input P in the model. This is because the input P in the model is determined for specific modelled catchments whose P value is heavily influenced by the P measured in local rainfall stations.
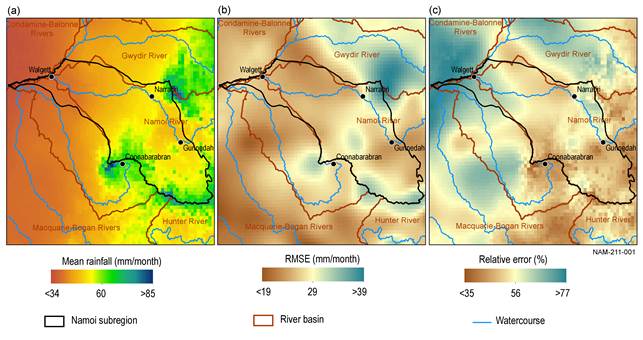
Data: Bioregional Assessment Programme (Dataset 2)
For air temperatures, a meteorological variable that has higher spatial autocorrelation than P, the regional distribution is governed by topography and distance from the ocean. The Tmax spatially-averaged long-term monthly mean is 23 °C for the Namoi subregion (Figure 4a). The associated RMSE is approximately 0.39 °C (Figure 4b), which leads to a relative error of 1.8% for Tmax (Figure 4c). For Tmin there are similar spatial patterns, with the spatially-averaged long-term monthly mean being 10 °C (Figure 5a) and the associated RMSE being approximately 0.64 °C (Figure 5b), leading to a relative error of 7.5% (Figure 5c).
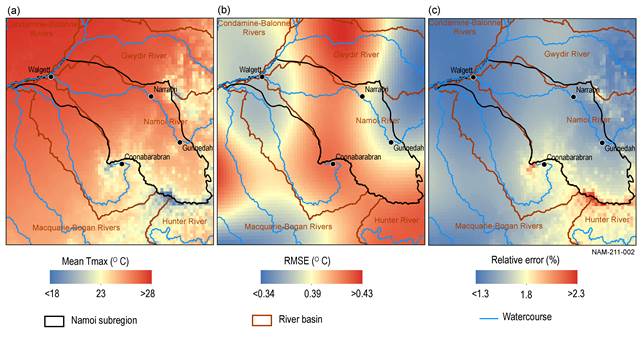
Data: Bioregional Assessment Programme (Dataset 2)
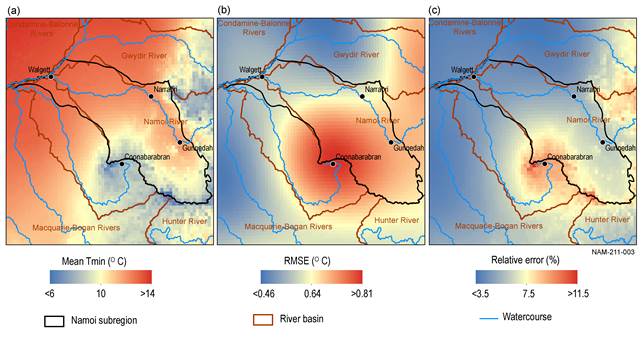
Data: Bioregional Assessment Programme (Dataset 2)
