2.1.3.1.1 Groundwater level data
There is an extensive network of monitoring bores in the Namoi subregion that are used for managing the water resources of the subregion. Over the historical period (1983–2012) there were 2934 bores with at least one observation of the groundwater level with over 800,000 total data points. The vast majority of these bores are located in the alluvium where the water resources are being utilised (Figure 17a).
However, the majority of these bores have a low reliability in their coordinates and elevation as recorded in the NGIS dataset (NSW Office of Water, Dataset 1). If the location is estimated from a map, the elevation then read from a digital elevation model (DEM) and the top of casing not measured above ground level then there are three forms of error in the estimate of the groundwater level that could cumulatively add up to over 10 m. In other BA regions (refer to Cui et al. (2016) and Herron et al. (2018b) for groundwater numerical modelling in the Clarence‑Moreton bioregion and Hunter subregion respectively) the criterion used for including the bore in observations has been that the observation bore must have either the location or elevation located via surveying or GPS. When this criterion is used in the Namoi subregion there are only 170 observation bores remaining (Figure 17b) (and 33 of these lack a depth attribute). The observation in these bores are used for evaluating the objective function and constrain the model predictions.
Data: Bioregional Assessment Programme (Dataset 2)
2.1.3.1.2 Hydraulic conductivity data
Each of the coal development proponents has undertaken field investigations into the hydraulic properties of the materials at their site (AGE Pty Ltd, 2010, 2011; Aquaterra, 2009; Douglas Partners, 2010; GeoTerra, 2008; GES, 2012; GHD, 2007; Heritage Computing, 2012; RCA Australia, 2004, 2007, 2010; RPS Aquaterra, 2011; Sigra, 2006). The hydraulic conductivity data has been generated using a variety of methods including core testing, drill stem tests, packer tests, slug tests and pump tests. Other sources of data that have been collated are a study investigating the properties of the aquitards in the region using core data (Esteban et al., 2016) and the pump tests conducted by the NSW Office of Water (now DPI Water) (DPI, 2010). There are 463 measurements of hydraulic conductivity that have been collated and are detailed in Bioregional Assessment Programme (Dataset 2).
These data have been collated by the hydrostratigraphic layer that is used in the numerical groundwater model (in companion product 2.6.2 for the Namoi subregion (Janardhanan et al., 2018)). The numerical groundwater model isolates the layers that have important water-dependent assets (alluvium and Pilliga Sandstone) and significant stresses imposed through coal development (Hoskissions Coal and Maules Creek Formation). All other geological formations have been lumped into interburden layers. The hydrostratigaphic layers used in the numerical groundwater model and some examples of the geological formations that they represent are shown in Table 5.
Table 5 Hydrostratigraphic layers used in the numerical groundwater model and some examples of the geological formations that these layers represent
These are examples and not a complete list
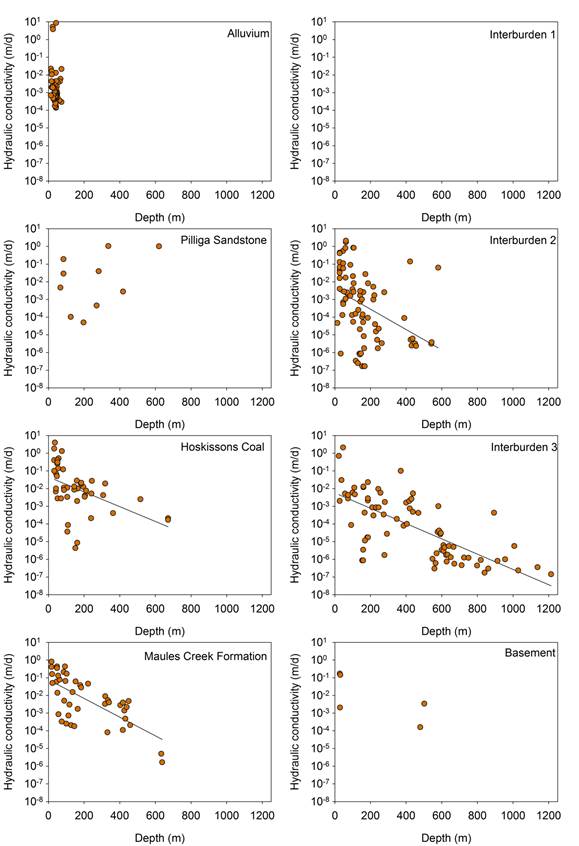
The measured hydraulic conductivity data have been plotted against depth for the hydrostratigraphic layers used in the numerical modelling (Figure 18). It has been shown in other regions that hydraulic conductivity decreases with depth (Peeters et al., 2018; Herron et al., 2018b). This is also true for the Namoi subregion where the coal-bearing formations of Hoskissons Coal and Maules Creek Formation and also the interburden layers 2 and 3 show similar depth-dependant relationships. The alluvium and Pilliga Sandstone do not appear to have a depth-dependent relationship and there are insufficient data to assess whether a relationship between depth and hydraulic conductivity exists for the basement and Interburden 1.
The lines on this plot are a linear regression line through all the data points for illustrative purposes only, it is not used anywhere. Where the line is present it is statistically significant (p<0.05), where there is no line present then the line of best fit was not statistically significant.
Data: Bioregional Assessment Programme (Dataset 3)
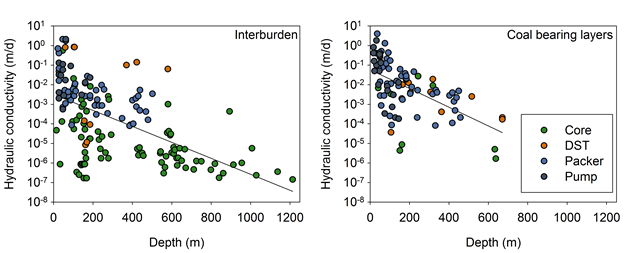
The relationships with depth for the hydraulic conductivity in the Hoskissons Coal and Maules Creek formations appear to be from the same population, and similarly the Interburden 2 and Interburden 3 layers appear to be from the same population (Figure 18). To simplify the analysis, the datasets for the coal-bearing formations have been grouped together and the interburden layers have been combined with the basement (Figure 19); this shows that the coal-bearing formations generally have a hydraulic conductivity an order of magnitude greater than the interburden for a given depth. The Pilliga Sandstone does not have a depth dependant hydraulic conductivity function implemented in the numerical groundwater model and the alluvium has a uniform hydraulic conductivity for each of its two layers (see Janardhanan et al. (2018) for more details).
The magnitude of the measured hydraulic conductivity also appears to have a dependency on the scale of measurement. The core tests, being the smallest scale, have smaller hydraulic conductivity than the pump test which is at a larger scale (Figure 19). This is the expected result based on other studies (Rovey and Cherkauer, 1995).
The lines on this plot are a linear regression line through all the data points for illustrative purposes only, it is not used anywhere.
DST = Drill stem test
Data: Bioregional Assessment Programme (Dataset 3)
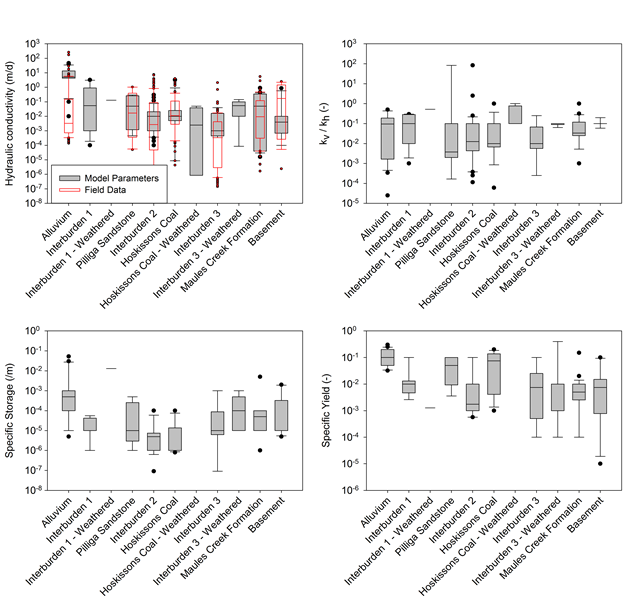
The hydraulic properties used in previous numerical groundwater modelling in the Namoi subregion have been collated and aggregated into the hydrostratigraphic layers that are used in the BA model (refer to companion product 2.6.2 for the Namoi subregion (Janardhanan et al., 2018)). The previous models reviewed for their hydraulic properties were the regional-scale models of the Namoi Catchment Water Study (SWS, 2012) and the Gunnedah Basin Regional Model (CDM Smith, 2014) as well as the smaller models for mine environmental impact statements (EISs) (AGE Pty Ltd, 2010, 2011, 2013; Aquaterra, 2009; Douglas Partners, 2010; GeoTerra, 2008; Heritage Computing, 2012, 2013; Hydro Simulations, 2014, 2015; RCA Australia, 2010). These models have used a wide range in hydraulic properties and there is little consistency between them (Figure 20). There are several inferences that can be extracted from this previous modelling:
- The alluvium has the highest median hydraulic conductivity, specific storage and specific yield. This is expected as it is the only unconsolidated layer within the model domain.
- Pilliga Sandstone also has relatively high hydraulic conductivity, specific storage and specific yield. This is expected as it is a productive aquifer.
- The median of the hydraulic conductivities of the coal-bearing formations is higher than the interburden, although the range in both is quite large.
- Some models (Heritage Computing, 2012, 2013; AGE Pty Ltd, 2011, 2013) have been developed using a weathered zone near the surface for some layers that have a higher conductivity and storage than the unweathered properties of that layer.
The box contains the interquartile range of the data, the line in the centre of the box is the median, the whiskers contain 95% of the data and the dots are those points that lie outside 95% of the data.
Data: Bioregional Assessment Programme (Dataset 3)
Based on the observed measurements and the previous modelling studies, the following hydraulic properties are used in the current modelling:
- The alluvium has been split into two layers with Alluvium 1 (Narrabri Formation) having lower hydraulic conductivity than Alluvium 2 (Gunnedah and Cubbaroo Formation). The hydraulic properties of the alluvium do not have a dependence on depth.
- The Pilliga Sandstone will use a single parameter range as there is no evidence of a depth dependence in the little observation data that are available.
- The coal-bearing formations (Hoskissons Coal and Maules Creek Formation) have similar hydraulic properties and so will use the same parameter distributions. There is a depth dependence on the hydraulic conductivity and also a zone of enhanced hydraulic conductivity due to weathering near the surface.
- Interburden 2 and Interburden 3 have similar hydraulic properties and so will use the same parameter distributions. There is a depth dependence on the hydraulic conductivity and also a zone of enhanced hydraulic conductivity due to weathering near the surface. Due to a lack of measured data and a lack of differentiation in the previous modelling efforts, the Interburden 1 and Basement hydraulic properties are also drawn from the same parameter space as Interburden 2 and Interburden 3.
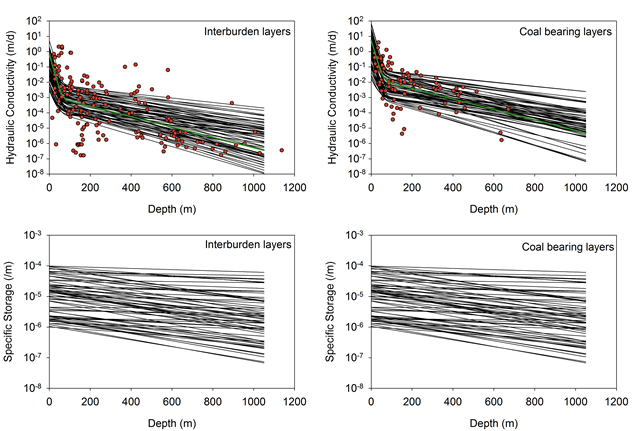
The depth dependence of the interburden layers and coal-bearing formation is modelled as an exponential decay (given the linear fit through log-transformed data) with depth, with an enhancement due to weathering in the top 100 m for hydraulic conductivity. For the hydraulic conductivity the model fitted is:
|
|
(1) |
where k(d) is the hydraulic conductivity (k, m/day) at a certain depth d, (m), we is the enhancement due to weathering (orders of magnitude), k0 is the hydraulic conductivity of fresh material at the surface and αk is the decay constant. The green line in Figure 21 is a least squares fit of the measured hydraulic conductivity data (red dots) for the interburden and coal-bearing layers. The black lines are 64 random realisations of the parameter space that is used in the sensitivity analysis (described in companion product 2.6.2 for the Namoi subregion (Janardhanan et al., 2018)). (The green line fitted to the interburden in Figure 21 sits toward the lower half of the parameter space used as the many core samples give a low bias to the hydraulic conductivity data).
The depth dependence of the specific storage is modelled as:
|
|
(2) |
where SS(d) is the specific storage (SS, m-1) at a certain depth (d, m), SS0 is the specific storage at the surface and αS is the decay constant. The black lines in Figure 21 are 64 random realisations of the parameter space that is used in the sensitivity analysis (described in companion product 2.6.2 for the Namoi subregion (Janardhanan et al., 2018)).
Red dots are measured hydraulic conductivities, the green line is a line of best fit through the measured data and the black lines are selection of parameter sets used in the modelling, each model run get its own black line.
Data: Bioregional Assessment Programme (Dataset 3)
2.1.3.1.3 Alluvium connectivity
The Namoi alluvium has historically been interpreted as a three layer system in the Lower Namoi and a two layer system in the Upper Namoi. The upper layer (Narrabri Formation) has been assumed a fine-textured low-conductivity layer whereas the lower layer (Gunnedah Formation) is a predominantly sandy productive aquifer, and the paleovalley fill in the Lower Namoi (Cubbaroo Formation) is coarse textured sands and gravels (CSIRO, 2007). More recently it has been demonstrated that this is a gross simplification and that the valley fill sediments are representative of a distributive fluvial system and are an upward-fining sequence in response to a drying climate (Acworth et al., 2015; Kelly et al., 2014.
Giambastiani et al. (2009) and Blakers et al. (2011) have demonstrated that the trends in groundwater levels in nested piezometers can be used to establish vertical connectivity in the Namoi alluvium. As the groundwater model developed for BA (in companion product 2.6.2 for the Namoi subregion (Janardhanan et al., 2018)) is using a simplified two layer alluvium, an analysis of the water level trends will enable the spatial variability in the vertical hydraulic conductivity between these two layers to be data-driven rather than uniform across the aquifer.
All of the groundwater level data from the nested piezometers in the Namoi alluvium have been extracted from the National Groundwater Information System (NSW Office of Water, Dataset 1) for the historical period used in BA (start of 1983 to end of 2012). This has resulted in 347 nested piezometer sites with between two and six piezometers. For each piezometer the linear trend in the groundwater levels has been calculated for this 30-year period and the maximum difference in the slope of the trend line between piezometers in the same nest has been recorded.
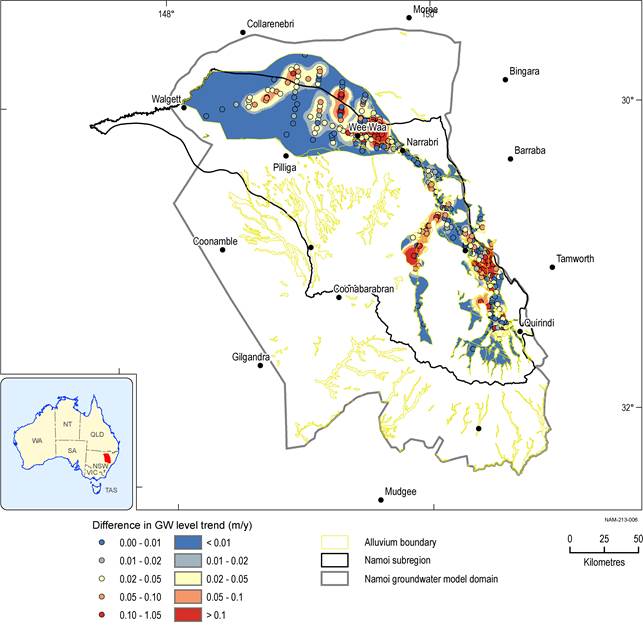
There is an assumption here that if the aquifer is well connected then there will be little difference in water level trend over this 30-year period, if there are significant differences in the water level trends at a nested site then it is assumed that the aquifer is poorly connected vertically. This is a simplistic analysis as it does not incorporate the stresses on the system (e.g. extraction for irrigation). A high, short-term stress may cause a difference in water level in a well connected nest of piezometers; by using the water level trends over 30 years the short-term impacts should be avoided. What cannot be avoided is that if there is no stress on the system then there is likely to be no difference in water levels even in a poorly connected aquifer.
These point data have been kriged to the alluvium boundary to create a spatial layer of the difference in groundwater level trends within the alluvium and this has been used to infer aquifer connectivity (Figure 22). Where the maximum difference in the groundwater level trend is low (<0.01 m/year) the aquifer is well connected; where the maximum difference in the groundwater level trend is high (>0.1 m/year) the aquifer is poorly connected.
These differences in the groundwater level trends are related to the kv/kh ratio that is used in layer 1 of the groundwater model (see companion product 2.6.2 for the Namoi subregion (Janardhanan et al., 2018) for more details).
Figure 22 Vertical connectivity of Namoi alluvium used in the Namoi groundwater model
Data: Bioregional Assessment Programme (Dataset 4)
2.1.3.1.4 Dryland diffuse recharge
Groundwater recharge from rainfall is a crucial input into numerical groundwater models. As there have not been previous estimates of recharge in the Namoi subregion at a scale suitable for the BA numerical modelling, a gridded recharge surface has been generated for the Namoi subregion using the chloride mass balance method (Anderson, 1945). This simple and cost-effective method for estimating recharge is the most commonly used method in Australia due to the availability of data to support it (Crosbie et al., 2010).
The assumptions that underpin the chloride mass balance method are summarised (Wood, 1999):
- Chloride in groundwater is only sourced from rainfall (not rock weathering or interactions with streams or deeper aquifers).
- Chloride is conservative in the system (no geological sources or sinks).
- The chloride flux does not change over time (steady-state conditions).
- There is no recycling of chloride in the system (e.g. due to irrigation drainage).
If these assumptions are met, then recharge can be estimated as follows:
|
|
(3) |
where recharge (R) is in mm/year, chloride deposition (D) is in kg/ha/year and the chloride concentration of groundwater [Cl-]gw is in mg/L.
As the Namoi model domain is larger than the Namoi subregion and contains parts of the Hunter, Central West and Gwydir subregions (see companion product 2.6.2 for the Namoi subregion (Janardhanan et al., 2018)), the recharge for the Namoi subregion was estimated together with these other regions. The area assessed here contains the outcropping area of the geological Gunnedah Basin, the geological Sydney Basin and a part of the geological Surat Basin.
The chloride deposition over the area of interest was extracted from the national dataset at a resolution of 0.05° (Leaney et al., 2011) (CSIRO, Dataset 5 ). This dataset was created from 297 field measurements of chloride deposition at point locations and then fitted to the model of Keywood et al. (1997). Figure 23a shows chloride deposition to be much greater near the coast compared to inland areas, which is due to decreasing concentrations of atmospheric salts as distance from the sea increases.
The chloride concentrations of groundwater were obtained from data collected by NSW Office of Water (now DPI Water) (NSW Office of Water, Dataset 6). There are 4786 points covering several decades of chloride data in the area of interest (Figure 23a). A borehole may have one or more observations; where there were multiple observations for a borehole, the geometric mean was used to characterise the chloride concentration, otherwise the isolated value was used. At each location, the chloride data were assigned to a stratigraphic layer based on mapped surface geology (Geoscience Australia, Dataset 8) where better data did not exist. In most cases it was assumed that the bores were completed into the stratigraphic layer representing the surface geology; there were only a few where the information existed to show otherwise (e.g. bores drilled through the Rollings Downs Group to sample the Pilliga Sandstone).
In alluvial areas, the chloride signal reflects not only a contribution from rainfall, but also from streams and upward flow from deeper aquifers, this is illustrated in detail by Raiber et al. (2016) in the Clarence-Moreton bioregion. Consequently, the first assumption of the chloride mass balance method is not met and 3235 data points from alluvial areas were excluded from the analysis. The remaining 1551 measurements of groundwater chloride concentration were used to calculate point estimates of recharge. Figure 23b shows the spatial distribution of these 1551 data points. They are not uniformly distributed across the area of interest with better spatial coverage of recharge estimates in the Upper Namoi.
The second assumption in the chloride mass balance methodology is that the chloride is conservative in the system. In areas without halite deposits it is generally assumed that there are no geological sources of chloride and the trace amounts of vegetation uptake are recycled to the systems as leaves decay.
The assumption of steady-state conditions is difficult to meet in any area where there has been land use change. This can be mitigated by only using shallow bores as the water sampled would be younger. If deep bores are used then there is the possibility of having a low bias to the recharge estimates. An attempt was made to only include analyses of younger water by only including bores in the analysis that were screened in the same stratigraphic layer as the surface geology (e.g. bores sampled from the Pilliga Sandstone were excluded if they were overlain by the Rolling Downs Group). The median drilled depth of the bores used was 35 m.
The assumption of no recycling of chloride can be achieved by not using bores that are in areas under irrigation.
(a) chloride deposition and the chloride concentration of the watertable aquifer (Cl), (b) mean annual rainfall and the point estimates of recharge (excluding points on alluvium)
Data: CSIRO (Dataset 5), NSW Office of Water (Dataset 6), Bioregional Assessment Programme (Dataset 7), Bureau of Meteorology (Dataset 9)
To generate a continuous surface of recharge estimates for input into the groundwater model, the point estimates derived from the chloride mass balance method needed to be upscaled. Crosbie et al. (2010) found that mean annual rainfall, soil type and vegetation type are the key determinants of recharge. Crosbie et al. (2013) used these variables successfully to upscale point estimates to a continuous recharge surface. However, due to the paucity of point recharge estimates under different soil and vegetation types in the area of interest, the mean annual rainfall (Bureau of Meteorology, Dataset 9) and nine different classes of surface geology have been used as covariates (Figure 24). The nine geological classes were generally based on the age of the sediments and sedimentary rocks and are an extension of those used in the Hunter subregion (product 2.1-2.2 for the Hunter subregion (Herron et al., 2018a)). As the Namoi groundwater model also includes parts of the Hunter, Central West and Gwydir subregions, the chloride in groundwater data from these subregions has also been used in generating the relationships used for upscaling.
Figure 24 Surface geology groups used in estimating recharge for the Namoi groundwater model
Data: Bioregional Assessment Programme (Dataset 7)
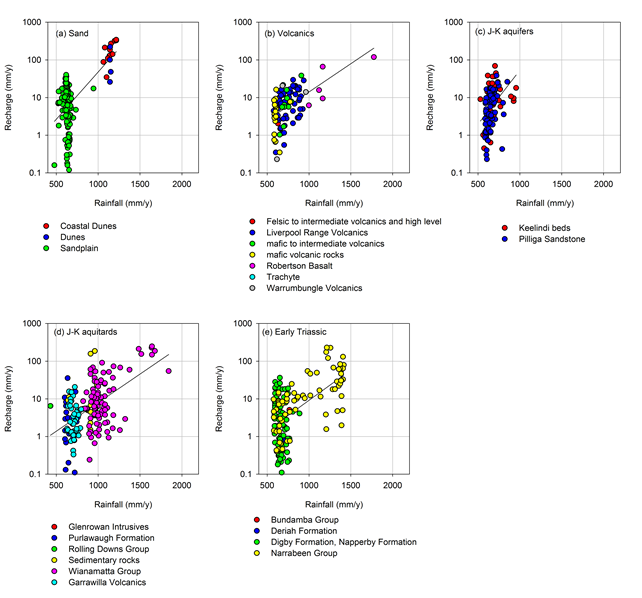
A log-linear relationship was adopted for estimating mean annual recharge from mean annual rainfall. This is similar to relationships developed previously from both field and modelled data (Crosbie et al., 2010, 2013). Use of a log-linear relationship can result in recharge rates at the higher end of the rainfall spectrum that are greater than rainfall (especially when extrapolated beyond the range of the field data). To prevent this, a global maximum recharge rate equal to half the rainfall was imposed, which is approximately the highest recharge estimated from the point scale chloride mass balance estimates. As the chloride mass balance method was not appropriate for alluvial areas, empirical relationships developed from historical field data to predict recharge using mean annual rainfall (Bureau of Meteorology, Dataset 9), soil clay content (CSIRO, Dataset 10) and vegetation (Australian Bureau of Agricultural and Resource Economics and Sciences, Dataset 11) were used (Wohling et al., 2012).
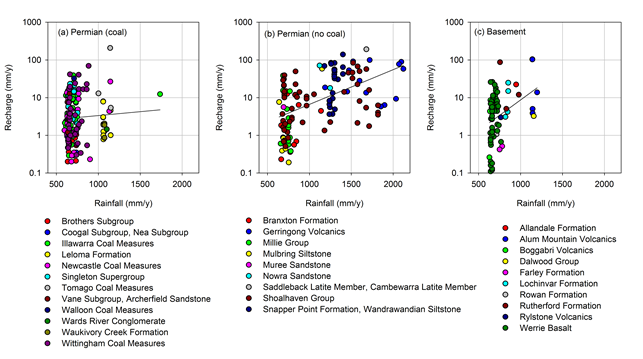
Figure 25 and Figure 26 show the log-linear relationship for estimating mean annual recharge from mean annual rainfall. This shows that for a given rainfall amount the Sand, Volcanics and J-K aquifers classes have comparably more recharge than the other classes; this is consistent with these being the productive aquifers in the region. The coal-bearing formations (Permian (coal)) tend to have recharge that is similar to that of the interburden layers (Permian (no coal), Early Triassic and J-K aquitards).
The black line is the line of best fit through the data points, this is one realisation of 1000 used in the upscaling.
Data: Bioregional Assessment Programme (Dataset 7)
The black line is the line of best fit through the data points, this is one realisation of 1000 used in the upscaling.
Data: Bioregional Assessment Programme (Dataset 7)
The relationship between rainfall and recharge for each surface geology group would allow a deterministic estimate of recharge to be developed. However, an estimate of the uncertainty around this deterministic estimate is necessary for carrying out the sensitivity and uncertainty analyses in the numerical groundwater modelling. The sources of uncertainty that can be quantified are the chloride deposition and the regression function. The chloride deposition shown in Figure 23 is the best estimate reported by Leaney et al. (2011), who also produced gridded estimates of the mean, standard deviation and skewness from 1000 equally well-calibrated replicates (CSIRO, Dataset 5). These gridded datasets were used to stochastically generate ten alternate chloride deposition grids. Each of these ten deposition grids were used to generate the regression equations between mean annual rainfall and mean annual recharge using bootstrapping (Efron and Tibshirani, 1994) with replacement for ten replicates. This provided 100 replicate regression equations to use in up-scaling. ‘Bootstrapping’ is a statistical method that involves random sampling with replacement. In this case it has been used by leaving out some of the data points and replacing them with replicates of other data points and then re-calculating the regression equation. This allows for an estimate of the uncertainty in the regression equations developed between rainfall and recharge.
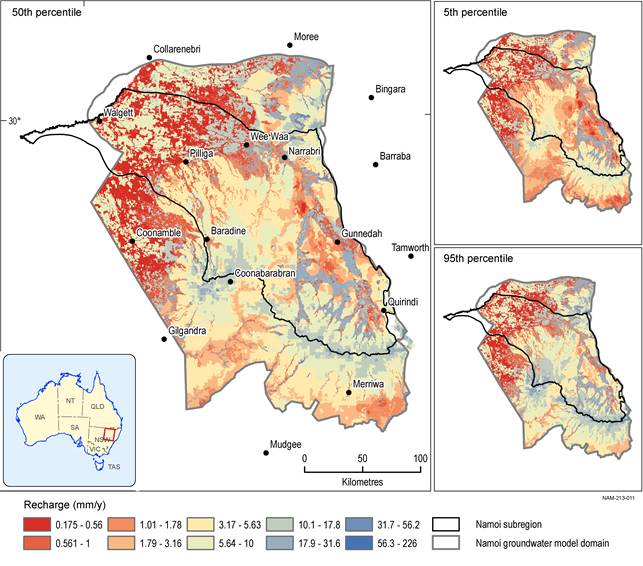
The upscaled recharge estimates across the Namoi groundwater model domain are shown in Figure 27 as the 5th, 50th and 95th percentiles of the 100 replicates. The highest recharge is associated with the alluvium with sandy soils and the volcanics of the Liverpool Ranges and Warrumbungles, the lowest recharge is under the alluvium with fine-textured soils and where the Permian units outcrop. The areally averaged recharge for the 50th percentile of the 100 replicates is 6.9 mm/year, with the 5th and 95th percentiles being 5.8 and 8.6 mm/year respectively for the Namoi model domain. (Note that large areas are covered by alluvium which does not have any uncertainty associated with the recharge estimates).
Data: Bioregional Assessment Programme (Dataset 7)
The limitations of the recharge estimation as applied here relate to the assumptions underpinning the methodology: by not accounting for the chloride that is lost from the system through surface runoff, recharge can be overestimated; whereas not accounting for the enhanced deposition on forested areas leads to underestimating recharge. The assumption of steady-state conditions will be violated in areas that have not attained equilibrium following the clearing of native vegetation for agriculture. The clearing of native vegetation generally leads to an increase in recharge. A chloride in groundwater sample from immediately (~cm) below the water table will be an estimate of current recharge, a very deep (>100 m) sample is likely to be an estimate of historical recharge prior to land clearing. This effect has been minimised by only sampling bores in outcrop areas that are likely to be shallower than bores intersecting confined aquifers, however it is likely that some of the data points will be from recharge prior to land clearing which will likely lead to an underestimation of recharge. No attempt was made to quantify the impacts of such forms of uncertainty.
2.1.3.1.5 Groundwater quality
As groundwater quality was not modelled, no further analysis has been conducted. Contextual information on groundwater quality is provided in companion product 1.1 (Welsh et al., 2014) and product 1.5 for the Namoi subregion (Peña-Arancibia et al., 2016).

Product Finalisation date
- 2.1.1 Geography
- 2.1.2 Geology
- 2.1.3 Hydrogeology and groundwater quality
- 2.1.4 Surface water hydrology and water quality
- 2.1.5 Surface water – groundwater interactions
- 2.1.5.1 Observed data
- 2.1.5.2 Previous catchment-scale investigations on stream-aquifer interactions
- 2.1.5.3 Overview of controls on surface water – groundwater connectivity based on previous investigations in the Namoi river basin
- 2.1.5.4 Statistical analysis and interpolation
- 2.1.5.5 Gaps
- References
- Datasets
- 2.1.6 Water management for coal resource developments
- 2.1.6.1 Boggabri Coal Mine (baseline) and Boggabri Coal Expansion Project (ACRD)
- 2.1.6.2 Narrabri North Mine (baseline)
- 2.1.6.3 Narrabri South Project (ACRD)
- 2.1.6.4 Rocglen Mine (baseline)
- 2.1.6.5 Sunnyside Mine (baseline)
- 2.1.6.6 Tarrawonga Mine (baseline) and Tarrawonga Coal Expansion Project (ACRD)
- 2.1.6.7 Caroona Coal Project (ACRD)
- 2.1.6.8 Maules Creek Project (ACRD)
- 2.1.6.9 Watermark Coal Project (ACRD)
- 2.1.6.10 Vickery Coal Project (ACRD)
- 2.1.6.11 Narrabri Gas Project (ACRD)
- 2.1.6.12 Mine footprints
- References
- Datasets
- Citation
- Acknowledgements
- Currency of scientific results
- Contributors to the Technical Programme
- About this technical product


