This section describes the layers in the Namoi BA geological model that were derived from the CDM Smith model and the modifications that were made to the representation of the Surat Basin strata and alluvium.
Table 3 shows how the layers in the CDM Smith model correspond with the stratigraphy of the Namoi subregion and layers in the Namoi BA geological model.
Table 3 Comparison of geological layers in the CDM Smith model and the Namoi BA geological model
Based on NTEC (2013), BA = bioregional assessment, na = not applicable
The main source of geological information used in the CDM Smith model was 340 petroleum, CSG and coal wells, of which approximately 130 contain publicly available information and can be compared to well completion reports (WCR). A selection of these were accessed to compare the thickness and extent of stratigraphic layers as represented in the CDM Smith model with those in the WCR. Data for the remaining wells was not publicly available. The information on bore intercepts and maximum layer thickness for each layer of the CDM Smith model is shown in Table 4. The maximum thickness for each layer in the Australian Stratigraphic Units Database (Geoscience Australia and Australian Stratigraphy Commission, 2017) and from other published sources is also included in Table 4. There are some discrepancies between the CDM Smith model intercepts and thickness data in the database and published texts, which can be attributed to a number of reasons including extrapolation of point source (well) data to regional coverage, how stratigraphic data has been interpreted and correlated, the different scales at which data are collected (regional or local), areas with sparse data points and the dataset used (e.g. Santos have some WCR that are not publicly available). The model is just one of many possible representations of the system and is unlikely to be consistent with all the data available in the subregion.
Table 4 Well intercepts and maximum thickness for stratigraphic units in the CDM Smith model
aThis is the maximum thickness within the Namoi subregion, not across the full extent of the model domain
The alluvium layer was not determined by bore analysis but the data layers are drawn from the Upper and Lower Namoi groundwater models.
BA = bioregional assessment, na = not applicable, NA = not available
Maximum thickness for Gunnedah Basin units comes from Tadros (1993) and for the Surat Basin from Ransley et al. (2015). Maximum thickness for the alluvium comes from Barrett (2012).
2.1.2.2.1 Alluvium (Layers 1 and 2)
The alluvium layer in the CDM Smith model is based on the Upper and Lower Namoi groundwater models. These models were developed to determine sustainable diversion limits under the Murray Darling Basin Plan, and in the case of the Upper Namoi, the zones included in the modelling do not match groundwater source boundaries as recognised in the Upper Namoi water sharing plan. There is a discrepancy between geological mapping of alluvium and the modelled extent of alluvium in the upper reaches of streams in the Upper Namoi in the model.
There are small areas in the Lower Namoi where the thickness of the alluvium layer in the CDM Smith model is greater than 200 m, however other models of the alluvium, including Schlumberger Water Services (2011) and McNeilage (2006), have a maximum alluvium thickness of 170 m. This is confirmed by Kelly et al. (2014) reporting the maximum thickness in the Lower Namoi as 140 m.
Given the importance of the alluvium layer in any modelling of propagation of impacts to water-dependent assets, it was considered that improvements could be made to the extent and thickness of the alluvium as shown in the CDM Smith model. The alluvium layer was therefore removed from the CDM Smith model and the extent of the alluvium was determined using the regolith map (Craig, 2013) and the depth to alluvium was determined using the alluvium layer from the Schlumberger groundwater flow model (Schlumberger Water Services, 2012), which is the same as that used by the NSW Department of Primary Industries for water management in the Upper and Lower Namoi alluvium groundwater sources. The alluvium layer was then further divided into two layers for representation in the Namoi BA hydrogeological model. More detail on the alluvium is provided in Section 2.1.3 of this product and in companion product 2.6.2 for the Namoi subregion (Janardhanan et al., 2018).
2.1.2.2.2 Interburden 1 (Layer 3)
The data points used to build the Interburden 1 layer (the Blythesdale Group and Rolling Downs Group) in the CDM Smith model are limited to a small number of wells between Wee Waa and Narrabri. Given the availability of more recent data, the Assessment team replaced the Blythesdale Group and Rolling Downs Group layers in the CDM Smith model with the Rolling Downs Aquitard layer from the GAB Atlas (Geoscience Australia, Dataset 5) (Ransley et al., 2015) and referred to it as Interburden 1. The thickness and extent of the Interburden 1 layer in the Namoi BA geological model is shown in Figure 10, indicating it is thickening into the Surat Basin to the north and north-west of the Namoi subregion, where it is up to 353 m thick.
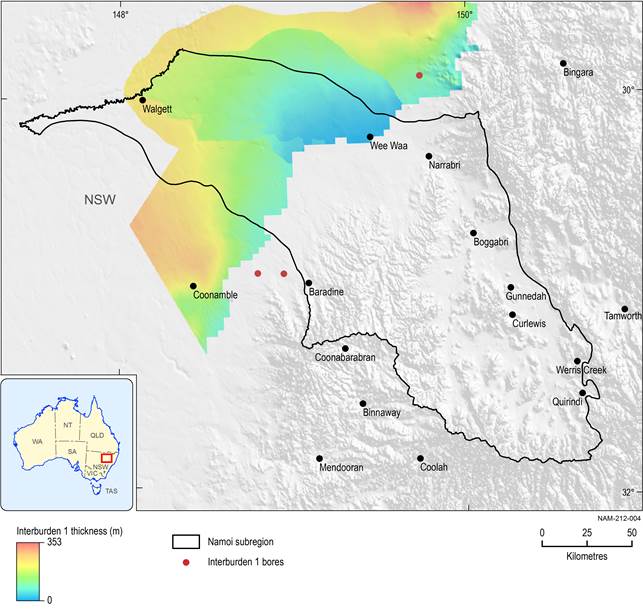
Figure 10 Thickness and extent of the Interburden 1 layer in the Namoi BA geological model
BA = bioregional assessment
Data: Geoscience Australia (Dataset 5)
2.1.2.2.3 Pilliga Sandstone (Layer 4)
The Pilliga Sandstone is widespread in the western part of the Namoi subregion and outcrops extensively along the eastern margin of the Surat Basin. The Pilliga Sandstone thickness in the Namoi subregion varies between 100 and 250 m.
The thickness and location of the outcropping Pilliga Sandstone in the CDM Smith model does not appear to correspond with other sources (e.g. Ransley et al., 2015). Given the availability of more recent data associated with the GAB Atlas (Ransley et al., 2015), the Assessment team replaced the layer for the Pilliga Sandstone in the Surat Basin with the Cadna-owie – Hooray aquifer and equivalents (Geoscience Australia, Dataset 6). The extent and thickness of the Pilliga Sandstone layer is shown in Figure 11, indicating it is up to approximately 800 m to the north and south of the Namoi subregion. The maximum thickness within the Namoi is approximately 400 m.
In the south-east of the subregion the Pilliga Sandstone, and underlying Purlawaugh Formation and Garrawilla Volcanics, identified in surface geology mapping are disconnected from the GAB and this has been referred to as the Oxley Basin or sub-basin (Dulhunty, 1940; O’Neill and Danis, 2013). A groundwater divide demarcates the boundary between the GAB and the adjacent Oxley Basin (Ransley and Smerdon, 2012), indicating the strata identified as GAB units in the south-east of the Namoi subregion are hydrogeologically disconnected from the main GAB strata. This is corroborated by this area being part of the Gunnedah – Oxley Basin Murray Darling Basin Groundwater Source (NSW Office of Water, 2012), not the NSW GAB Groundwater Source. The south-eastern extent of the Pilliga Sandstone in the Oxley Basin was derived from the CDM Smith model (CDM Smith, Dataset 4) and merged with Cadna-owie – Hooray aquifer and equivalents in the Surat Basin (Geoscience Australia, Dataset 6).
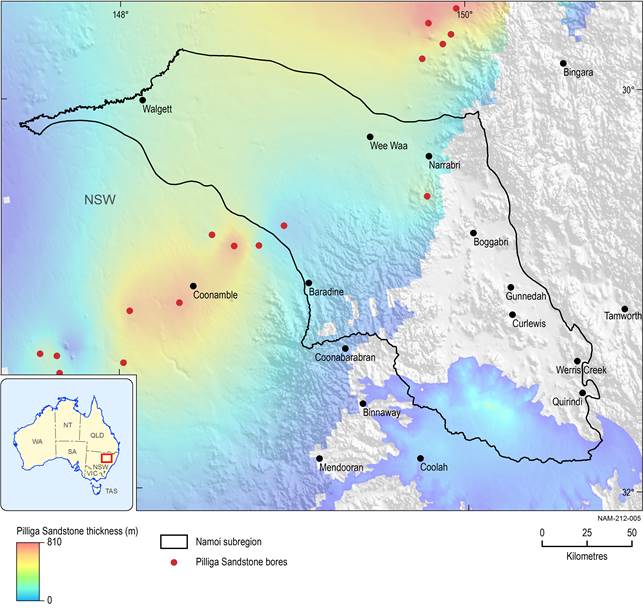
Figure 11 Thickness and extent of the Pilliga Sandstone layer in the Namoi BA geological model
BA = bioregional assessment
Data: CDM Smith (Dataset 4) and Geoscience Australia (Dataset 6)
2.1.2.2.4 Layer 5 (Purlawaugh Formation and Garrawilla Volcanics)
The Purlawaugh Formation and Garrawilla Volcanics are present in the Coonamble Embayment of the Surat Basin and disconformably overlie the Napperby Formation (Tadros, 1993). To the west of the Gunnedah Basin, the Purlawaugh Formation and Garrawilla Volcanics overlie the Lachlan Fold Belt.
The thickness of the Purlawaugh Formation in the Coonamble Embayment is variable, ranging from a presumed maximum of 85 m (Hawke and Cramsie, 1984), thinning to the north and south to about 20 m thick (Radke et al., 2012). However, well completion reports from drill holes near Narrabri indicate the Purlawaugh Formation is significantly thicker than this, up to 190 m (e.g. Bohena 2 (Forcenergy, 1998), Bibblewindi 8 (Eastern Star Gas, 2007), Dewhurst 2 (Eastern Star Gas, 2008)). The western extent of the Purlawaugh Formation is poorly defined because most wells in this part of the Namoi subregion do not penetrate deeper than the base of the Pilliga Sandstone (Hawke and Cramsie, 1984).
The maximum thickness of the Purlawaugh Formation and the Garrawilla Volcanics in the CDM Smith model is approximately 285 m and 485 m, respectively. In some areas, particularly in the south of the subregion, the extent and thickness of the Purlawaugh Formation and Garrawilla Volcanics in the CDM Smith model are not compatible with the surface geology or WCR. Given the availability of more recent data from GABWRA (Smerdon et al., 2012) and the GAB Atlas (Ransley et al., 2015), the Assessment team used this information in the Namoi BA geological model.
The extent and thickness of Layer 5 in the Namoi BA geological model is shown in Figure 12. In the Surat Basin, layer 5 is the combined thickness from the base of the Pilliga Sandstone (Geoscience Australia, Dataset 7) to the base of the Jurassic–Cretaceous sequence (Geoscience Australia, Dataset 8). A regional unconformity at the base of the Purlawaugh Formation in the northern part of the Gunnedah Basin and the Garrawilla Volcanics in the southern and central parts of the Namoi subregion marks the base of the Surat Basin sequence and the top of the Gunnedah Basin sedimentary sequence. This regional unconformity means the base of the Jurassic–Cretaceous sequence is easily identified during drilling. In the western part of the subregion, outside the Gunnedah Basin, the base of layer 5 forms the base of the Namoi BA geological model.
The south-eastern extent of layer 5 in the Oxley Basin was derived from the combined thickness of the Purlawaugh Formation and Garrawilla Volcanics in the CDM Smith model (CDM Smith, Dataset 4).
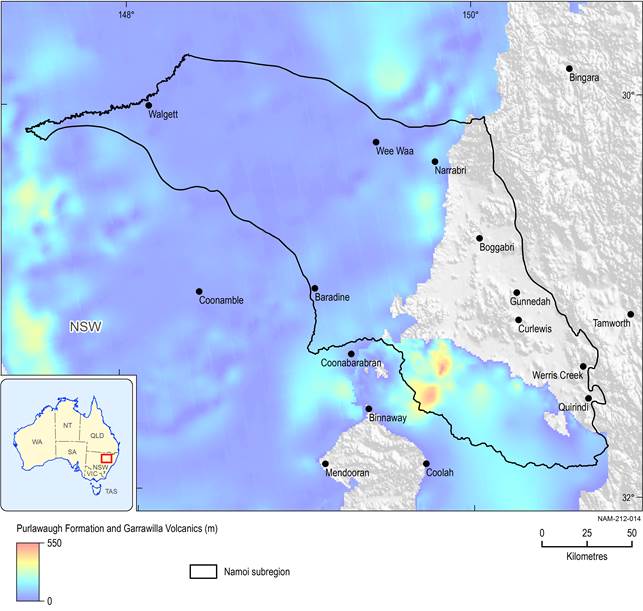
Figure 12 Thickness and extent of Layer 5 in the Namoi BA geological model
BA = bioregional assessment
Data: CDM Smith (Dataset 4), Geoscience Australia (Dataset 7, Dataset 8)
2.1.2.2.5 Interburden 2 (Layer 6)
For consistency with the hydrostratigraphic units in the numerical groundwater model (see companion product 2.6.2 for the Namoi subregion (Janardhanan et al., 2018)) the following layers from the CDM Smith model were amalgamated to create one layer for the Namoi BA geological model, termed Interburden 2:
- Deriah and Napperby formations
- Digby Formation
- Black Jack Group above Coal.
The Deriah Formation overlies the Napperby Formation and is mainly present in the northern part of the Mullaley sub-basin, and to a lesser extent in the south-western and central areas. The Napperby Formation conformably overlies the Digby Formation and has a relatively wide surface exposure, outcropping in a discontinuous belt extending south from Narrabri to the base of the Liverpool Plains. In the subsurface, the Napperby Formation occurs throughout the Gunnedah Basin, with the exception of the Maules Creek sub-basin (Tadros, 1993; Geological Survey of NSW, 2002). The Digby Formation unconformably overlies the Black Jack Group in the Mullaley sub-basin. Discontinuous outcrops of the Digby Formation extend south from Narrabri to the base of the Liverpool Ranges. In the subsurface, the Digby Formation covers much of the area of the Gunnedah Basin except in the Maules Creek sub-basin (Tadros, 1993). The Black Jack Group above Coal layer in the CDM Smith model is a composite layer of the Nea and Coogal subgroups that lie above the Hoskissons Coal. This layer includes the Clare Sandstone and the Benelabri, Trinkey and Wallala formations.
The thickness and extent of this merged layer is shown in Figure 13. The Interburden 2 layer incorporates the Triassic and Late Permian strata of the Gunnedah Basin above the Hoskissons Coal and includes a range of rock types. Representing multiple Permian and Triassic units in a single layer within the geological model will under-represent the variability within this layer, however, given the regional scale of the model, the relatively coarse model resolution is considered appropriate.
There are thickness errors and modelling artefacts in some of the layers that comprise Interburden 2, and these errors are not consistent between layers or spatially across the region. In some cases, the errors within each unit that makes up Interburden 2 may be additive such that the Interburden 2 layer may be significantly thicker than the data would imply. In other cases, one unit may be thinner than the data indicates and the adjacent unit thicker, resulting in a thickness of Interburden 2 that may represent reality, despite errors in the original layers. These errors will not be consistent or easily discernible. However, the primary purpose of the Namoi BA geological model is to create regional stratigraphic layers that may be translated into the numerical groundwater model. It does not provide the level of lithological information that is represented in local-scale models for smaller areas within the Namoi subregion.
The Interburden 2 layer is intercepted by a large number of wells primarily targeting the Hoskissons Coal. The maximum thickness of the layer is 1038 m at the southern boundary of the subregion (Figure 13). The exaggerated thickness in this area is not likely to impact model outputs as there are no coal resource developments in this area.
There are some inconsistencies between the extent of the strata comprising the Interburden 2 layer in the CDM Smith model and geological mapping (Pratt, 1996, 1998). For example, published geological mapping (Figure 8) shows outcropping Napperby Formation and Deriah Formation in the north-east of the subregion that is not represented in the CDM Smith model and there is a large thickness of Digby Formation in the CDM Smith model to the west of Gunnedah Basin boundary, which is not constrained by any well data. However, given the regional scale of the model and the location of coal resource developments, these discrepancies are not considered to impact model outputs.
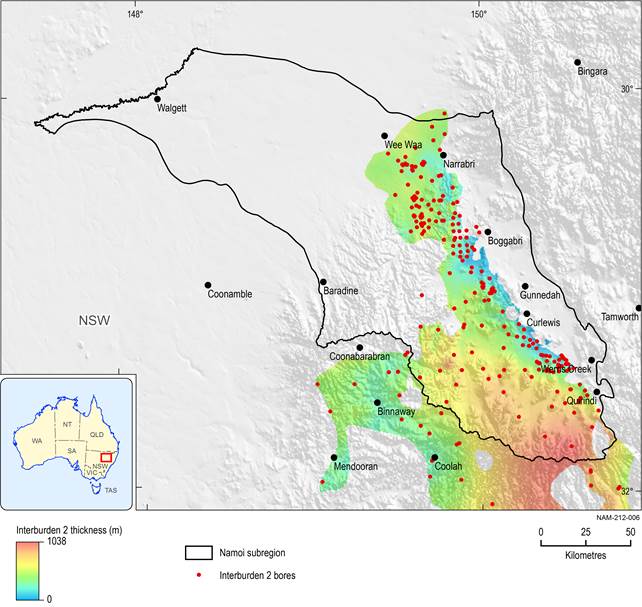
Figure 13 Thickness and extent of the Interburden 2 layer in the Namoi BA geological model
BA = bioregional assessment
Data: CDM Smith (Dataset 4)
2.1.2.2.6 Hoskissons Coal (Layer 7)
The Hoskissons Coal within the Black Jack Group is the major economic seam in the Mullaley sub-basin and extends from Narrabri in the north to beyond the southern boundary of the Namoi subregion (Figure 14). According to Tadros (1993), the thickness of the Hoskissons Coal ranges from less than one metre in the west to up to 13 m in the north and 19 m in the south-east of the Namoi subregion. Maximum recorded thickness of the Hoskissons Coal in the Australian Stratigraphic Units Database is 18 m. The maximum thickness of the Hoskissons Coal layer in the CDM Smith model (within the Namoi subregion) is approximately 130 m, south of Mullaley, however this appears to be due to a single data point being incorrectly interpreted (see Figure 14). There are also areas of significantly thicker Hoskissons Coal to the south-west and west of Narrabri and south-west of Quirindi. The thickness of the Hoskissons Coal in these areas appears to have been incorrectly transcribed from some WCR (e.g. Wilga Park 1 (Hartogen Energy Limited, 1986) and Wilga Park 1, 1C and 2 (Forcenergy, 1999a, 1999b, 1999c)) during geological model development, with the Black Jack Group being picked instead of just the Hoskissons Coal. This results in the Hoskissons Coal layer being thicker than suggested by the publicly available WCR in some areas. Bullseyes are also apparent in the Hoskissons Coal layer thickness map (e.g. south of Mullaley) and other modelling artefacts (e.g. the thicker areas of Hoskissons Coal to the west of Narrabri that does not appear to be constrained by data). To the south-east of the subregion the maximum thickness of the Hoskissons Coal is 354 m. This appears to be a result of a modelling artefact as it is not constrained by data, however given this area is outside the Namoi subregion and not near coal resource developments, this excessive thickness of coal is not considered to be of consequence for the Namoi BA.
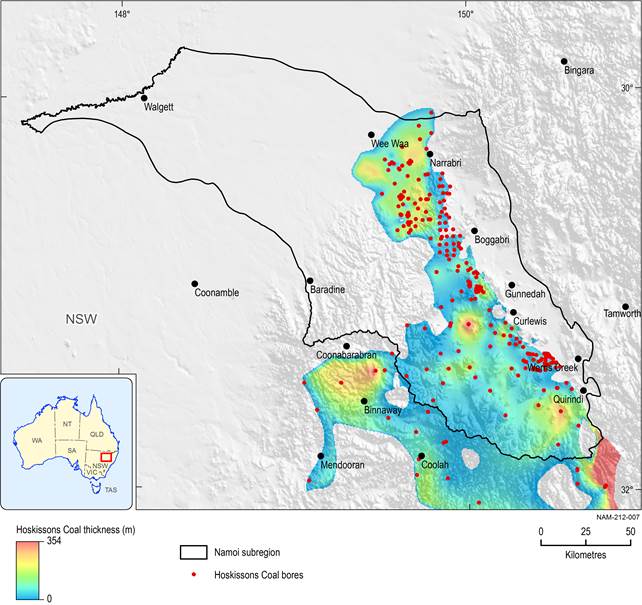
Figure 14 Thickness and extent of the Hoskissons Coal layer in the Namoi BA geological model
BA = bioregional assessment
Data: CDM Smith (Dataset 4)
2.1.2.2.7 Interburden 3 (Layer 8)
The layer described as Interburden 3 in the Namoi BA geological model comprises the Black Jack Group below Coal and the Millie Group layers, as represented in the CDM Smith model. The Black Jack Group below Coal layer in the CDM Smith model comprises the Brothers subgroup, the oldest part of the Black Jack Group. The basal component of the Interburden 3 layer is the Millie Group, which comprises the Porcupine and Watermark formations. The Millie Group is present in the subsurface over much of the Mullaley sub-basin.
The thickness and extent of Interburden 3 is shown in Figure 15 as up to 1026 m thick, with the thickest extent occurring in the south of the subregion. This appears to be an anomalous result in the Black Jack Group above Coal layer in the CDM Smith model and an artefact of model development given this area not constrained by bore data. Along the eastern side of the Mullaley sub-basin the layer is well constrained by bore data.
To the south-west and south of Narrabri, there are areas in the CDM Smith model where the Black Jack Group below Coal layer is either very thin or absent. In some instances, the Black Jack Group below Coal has not been interpreted from the WCR during model development, and instead the entire sequence has been assigned to the Hoskissons Coal, despite many WCR clearly showing the presence of Black Jack Group below Coal (e.g. Dewhurst 5 (Eastern Star Gas, 2008), Strathmore 2 (Eastern Star Gas, 2011) and Wilga Park 2 (Forcenergy, 1999c)). This results in areas where the Black Jack Group below Coal layer is thinner, and the Hoskissons Coal layer is thicker than anticipated.
With the exception of the issue identified above, the geologic interpretation of the Interburden 3 layer is generally sufficiently comparable with WCR and geological mapping (Pratt, 1996, 1998) to suggest the layer is representative of the Black Jack Group below Coal and the Millie Group at a regional scale, especially in the area of coal resource development in the Namoi subregion.
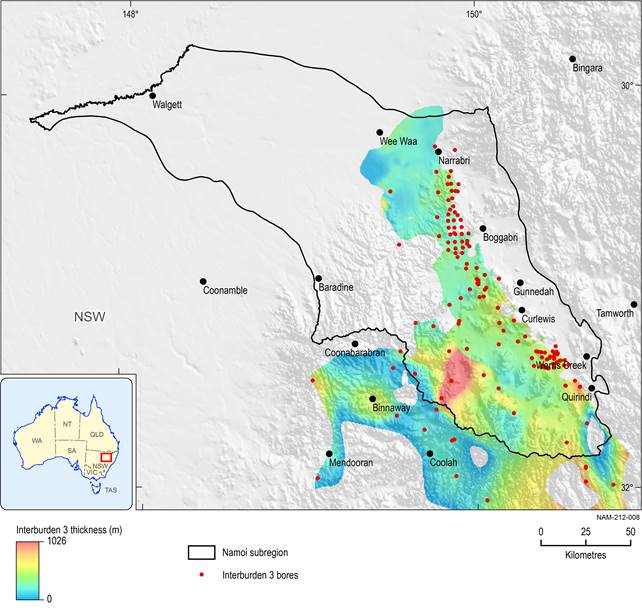
Figure 15 Thickness and extent of the Interburden 3 layer in the Namoi BA geological model
BA = bioregional assessment
Data: CDM Smith (Dataset 4)
2.1.2.2.8 Maules Creek Formation (Layer 9)
The Maules Creek Formation includes several economically important coal seams that are targeted by a number of coal mines, predominantly in the Maules Creek sub-basin adjacent to the Hunter-Mooki Thrust Fault System. The Maules Creek Formation outcrops on the eastern and western sides of the Boggabri Ridge. In the Mullaley sub-basin the Maules Creek Formation outcrops near Gunnedah, and is generally less than 100 m thick. In the Maules Creek sub-basin, the Maules Creek Formation thickens in the east in excess of 800 m (Tadros, 1993; Geological Survey of NSW, 2002).
The Maules Creek Formation layer in the Namoi BA geological model is equivalent to that in the CDM Smith model. The extent of the Maules Creek Formation in the CDM Smith model is in general accordance with surface geology maps (Pratt, 1996, 1998) and geologic intercepts for the Maules Creek Formation in WCR. The extent and thickness in the Mullaley sub-basin is well constrained by data, however less so in the Maules Creek sub-basin (see Figure 16). However, the thickness is consistent with other sources (e.g. Tadros, 1993; Totterdell et al., 2009), so it is considered that the Maules Creek layer is fit for purpose for the Namoi BA geological model.
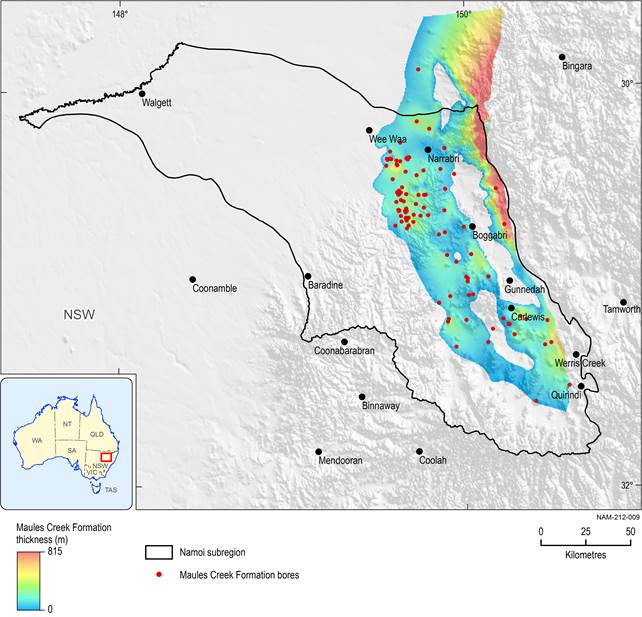
Figure 16 Thickness and extent of the Maules Creek Formation in the Namoi BA geological model
BA = bioregional assessment
Data: CDM Smith (Dataset 4)
2.1.2.2.9 Base of the model
The base of the Namoi BA geological model in the Gunnedah Basin is the upper surface of the Leard-Goonbri Formation, as modelled in the CDM Smith model. Where the Leard-Goonbri Formation is not present, the base of the model is the top of the Boggabri Volcanics and Werrie Basalt. In the west of the subregion the basement comprises the base of the Surat Basin sequence, predominantly the Garrawilla Volcanics.
