2.6.2.7.2 Predictions


The model is designed to estimate drawdowns caused by the coal resource developments in the modelled CRDP at specified locations in the upper Permian coal measures, the Clematis Group and the Cenozoic and Quaternary cover sediments. These model nodes are presented in Figure 4 and Table 4 in Section 2.6.2.1 . Table 14 conveys the same information, together with a short description of each model node, its water source and the model layer the model node is assigned to.

As outlined in Table 14, the water source for two model nodes is interpreted to be the Ronlow beds (part of the GAB). Conceptually, it is unlikely there could be measureable drawdown impacts to aquifers in the Ronlow beds due to its distance from coal resource development areas and the presence of a thick aquitard (the Moolayember Formation) between the Ronlow beds and the underlying Clematis Group. To test this hypothesis, some model nodes, for which the water source is the Ronlow beds, are incorporated into the model. For the sake of model simplicity and for minimising model runtimes, the decision was taken to attribute these model nodes to the Clematis Group. The reasoning being that, the probability of a measurable impact in the Ronlow beds will always be less than the probability of measurable impact in the underlying Clematis Group at these particular model nodes. A similar approach was also taken for model nodes associated with wetlands and streams underlain by the Moolayember Formation (e.g. Lake Galilee).

For one of the model nodes listed in Table 14, it is not deemed justified to estimate drawdown with the analytic element model. This is model node GAL_041, the Alpha town water supply. The town water supply sources water from the Belyando alluvium, which is only connected to the Galilee Basin via the Joe Joe Group. This part of the alluvium and the connection is not well represented in the analytic element model and drawdown at the Alpha town water supply is therefore not simulated.

In addition to the model nodes listed in Table 14 and Figure 4, drawdown is also calculated for each model layer at the model nodes indicated in Figure 10. These model nodes are distributed throughout the model domain with a higher density around areas of high potential hydraulic gradients (i.e. the coal mines and no-flow boundary).

Table 14 Model nodes for which drawdown due to coal resource development in the Galilee subregion was calculated with the groundwater analytic element model


ID

Easting

Northing

Description

Water source

Model layer

GAL_001

453657.9

7471715

Sandy Creek Belyando confluence / Sandy Creek GDE

Alluvium

0

GAL_002

467416.3

7391929

Native Companion Creek / Alpha Creek confluence, Native Companion Creek GDE

Alluvium

0

GAL_003

453168.4

7366093

Alpha Creek upstream of Alpha, Alpha Creek GDE

Alluvium

0

GAL_004

465511.3

7448484

Native Companion Creek GDE

Alluvium

0

GAL_005

449398.1

7451778

Sandy Creek GDE

Alluvium

0

GAL_006

443960.9

7409432

Sandy Creek

Alluvium

0

GAL_007

451739.7

7498689

Belyando River GDE just upstream of Fiery Creek anabranch

Alluvium

0

GAL_008

451700

7510913

Fiery Creek GDE anabranch

Alluvium

0

GAL_009

455986.2

7511072

Belyando River GDE

Alluvium

0

GAL_010

453565.3

7524605

Dunda Creek GDE / Fiery Creek GDE confluence

Alluvium

0

GAL_011

454795.6

7534884

Belyando River GDE

Alluvium

0

GAL_012

443564

7514485

Dunda Creek GDE

Alluvium

0

GAL_013

430030.6

7512183

Dunda GDE overlying Clematis Group

Alluvium

0

GAL_014

437055.3

7509603

Dunda GDE overlying Rewan Group

Alluvium

0

GAL_015

452414.4

7541155

Belyando GDE

Alluvium

0

GAL_016

449040.9

7538496

Belyando GDE anabranch

Alluvium

0

GAL_017

443802.2

7533932

Belyando tributary drainage line

Alluvium

0

GAL_018

453564.2

7556466

Carmichael – Belyando GDE confluence

Alluvium

0

GAL_019

437371.7

7555196

Carmichael GDE at confluence of two anabranches

Alluvium

0

GAL_020

430942.3

7554878

Carmichael GDE overlying Dunda beds subcrop

Alluvium

0

GAL_021

425756.4

7556783

Carmichael GDE overlying Clematis Group

Alluvium

0

GAL_022

421999.3

7558212

Dyllingo Creek near Moolayember Formation subcrop

Clematis Group

1

GAL_023

443060.2

7557895

Carmichael River GDE at subregion boundary

Alluvium

0

GAL_024

459411.5

7562340

Belyando River GDE

Alluvium

0

GAL_025

402631.8

7562670

Dyllingo Creek GDE near Clematis Group subcrop

Alluvium

0

GAL_026

388212

7563993

Dyllingo Creek GDE near Clematis Group / Moolayember Formation subcrop

Alluvium

0

GAL_027

382060.4

7565978

Dyllingo Creek GDE near Ronlow beds subcrop

Alluvium

0

GAL_028

413175.5

7591908

China Stone near Clematis Group outcrop

Clematis Group

1

GAL_029

389025

7518959

Lake Galilee wetlands (underlain by Moolayember Formation)

Clematis Group

1

GAL_030

388892.6

7534713

Lake Galilee wetlands (underlain by Moolayember Formation)

Clematis Group

1

GAL_031

441970.2

7513781

Cluster of groundwater licences in Betts Creek beds

Upper Permian coal measures

2

GAL_032

449673.4

7521390

Cluster of groundwater licences in Betts Creek beds

Upper Permian coal measures

2

GAL_033

427963.3

7508796

Cluster of groundwater licences in Clematis Group

Clematis Group

1

GAL_034

428043.8

7383876

Cluster of groundwater licences in Clematis Group / Dunda beds

Clematis Group

1

GAL_035

419180.2

7454256

Cluster of groundwater licences in Clematis Group / Dunda beds

Clematis Group

1

GAL_036

369975.8

7549910

Springnv38_Desert – source possibly Ronlow beds

Clematis Group

1

GAL_037

421384.5

7557193

Doongmabulla springs

Clematis Group

1

GAL_038

424294.9

7556829

Doongmabulla springs

Clematis Group

1

GAL_039

363390.3

7498810

Spring107A. Ronlow beds source

Ronlow beds

1

GAL_040

373047.6

7427372

Spring114. Ronlow beds source

Ronlow beds

1

GAL_041

463268.9

7384570

ALPHA TWS environs

Alluvium

NA

GAL_042

410776.3

7389482

JERICHO TWS environs

Clematis Group

1

GAL_043

446766.4

7532055

Mellaluka springs

Upper Permian coal measures

2

GAL_044

421085.9

7559288

Doongma spring_Burdekin_51

Clematis Group

1

GAL_045

438099

7484976

Hector spring_Burdekin_84

Upper Permian coal measures

2

GAL_046

443606.8

7494960

Albro springs_Burdekin_85

Upper Permian coal measures

2

GAL_047

423823.8

7557007

H202 Clematis Group monitoring bore

Clematis Group

1

GDE = groundwater-dependent ecosystem; TWS = town water supply; the topmost layer in the groundwater model is assigned ‘0’; NA indicates drawdown at model node could not be simulated. Potential hydrological change at this location will be discussed qualitatively in companion product 3-4 (impact and risk analysis) for the Galilee subregion.

Data: Bioregional Assessment Programme (Dataset 1); Bioregional Assessment Programme (Dataset 2)

The GW AEM calculates a time series of the change in groundwater level due to coal resource development. As initial conditions in each model layer are set equal to zero metres, this change in groundwater level corresponds to the drawdown. Figure 11 shows an example of these time series. For each model node, only the drawdown (dmax; the maximum difference in drawdown between the CRDP and baseline, due to additional coal resource development) and year of maximum change (tmax) are recorded and stored. Figure 11 illustrates how these values are calculated.

Figure 11

Figure 11 Time series of drawdown at selected model nodes (a) GAL_021 Carmichael groundwater-dependent ecosystem (GDE) overlying Clematis Group, (b) GAL_037 Doongmabulla Springs and (c) GAL_043 Mellaluka Springs for parameter combination 1980

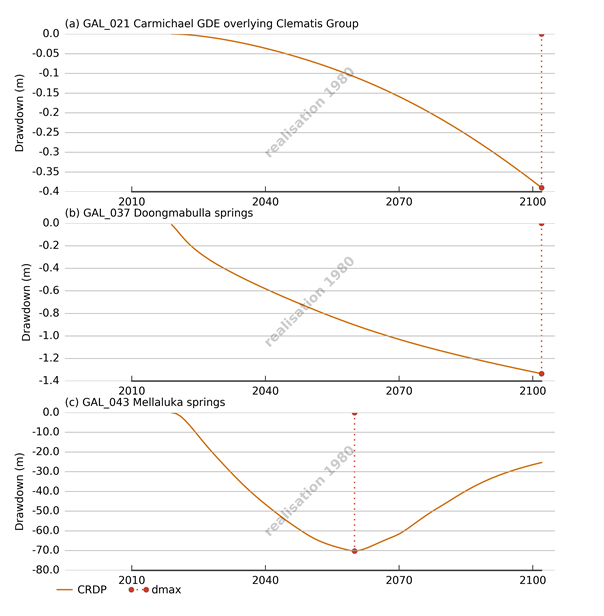
dmax = maximum difference in drawdown between the coal resource development pathway (CRDP) and baseline, due to additional coal resource development

CRDP = baseline + additional coal resource development

Data: Bioregional Assessment Programme (Dataset 1)

The graphs in Figure 11 show the results of parameter combination number 1980 of the 10,000 parameter combinations of the groundwater model that have been evaluated for the uncertainty analysis (Section 2.6.2.8). For this parameter combination, the drawdown is only realised within the simulation period in the upper Permian coal measures.

In the remaining sections of this product, the results of the modelling will always be presented as summary statistics of the resulting predictive distributions, such as the median dmax value or the probability that dmax exceeds a pre-specified threshold.

Last updated:
6 December 2018
Thumbnail of the Galilee subregion

Product Finalisation date

2018
PRODUCT CONTENTS

ASSESSMENT