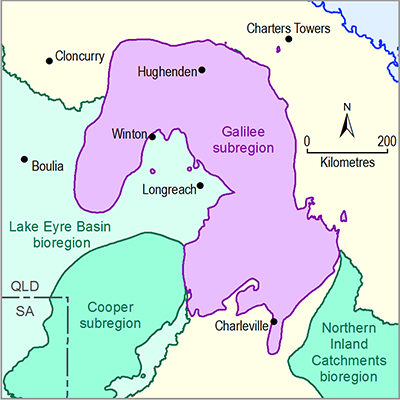
No developments were included in the baseline coal resource development (baseline), which is a future that includes all coal mines and coal seam gas (CSG) fields that are commercially producing as of December 2012. Most mine inflow rates were obtained from relevant environmental impact statements (EIS). Where applicable to the coal development, mine inflow rates outlined in EIS incorporate changes that may occur to aquifer parameters under post-mining fractured conditions.
Anticipated groundwater production rates for CRDP mines included in the GW AEM are outlined in Table 12. For two coal mine developments (Hyde Park and China Stone), groundwater production rates had to be estimated from proposed coal yields and assumed hydraulic conditions (Table 12) as relevant data were not available at the time of writing.
Table 12 Coal resource development pathway (CRDP) mines included in the groundwater analytic element model (GW AEM) and anticipated groundwater production rates from upper Permian coal measures partial aquifer
Data: Bioregional Assessment Programme (Dataset 1)
The coal mines are represented in the GW AEM as polygons, which outline the boundary of the mine working area (Figure 4 in Section 2.6.2.1). The mine working area represents the combined footprint of open-cut and underground mine areas that are active during one of the decadal modelling time periods (Table 12). For each mine working area, relevant pumping rates were applied to the polygon boundary.
For Kevin’s Corner, Alpha, Galilee and South Galilee coal projects, polygons that represent their mine working areas were digitised from mine scheduling maps in their respective supplementary environmental impact statements (Table 12).
For Carmichael and China Stone coal projects, the mine scheduling maps were not readily available at the time of building the GW AEM, so these were approximated using mine tenement boundaries.
Hyde Park, while an advanced and active development project, has (as of December 2015) not submitted an environmental impact statement for consideration by state government agencies. However, maps outlining mine scheduling are available and these were used to generate the mine working area polygons utilised in the model.
Where Cenozoic sediments were conceptualised to overlie a mine working area, a constant change in head of –10 m was applied at the edge of the mine working footprint, from the start of mining. All of the mines listed in Table 12 have an open-cut component in which the Cenozoic cover, if present, will be removed as part of the overburden. This creates a permanent drainage of the Cenozoic sediments, even after mining operations cease. There are insufficient data available to specify the drawdown in the Cenozoic cover at the edge of the mine footprint individually. Based on the thickness and potentiometric surface of the Cenozoic cover sediments (Section 2.1.2.2.5 and Section 2.1.3.3.2 in companion product 2.1-2.2 for the Galilee subregion (Evans et al. 2018a)), the constant specified drawdown of 10 m is a representative value of the saturated thickness of cover sediments at the mine locations.

Product Finalisation date
- 2.6.2.1 Methods
- 2.6.2.2 Review of existing models
- 2.6.2.2.1 Alpha and Kevin's Corner model review
- 2.6.2.2.2 Carmichael model review
- 2.6.2.2.3 China First model review
- 2.6.2.2.4 China Stone model review
- 2.6.2.2.5 South Galilee model review
- 2.6.2.2.6 Galilee Basin hydrogeological model review
- 2.6.2.2.7 Suitability of existing groundwater models
- References
- Datasets
- 2.6.2.3 Model development
- 2.6.2.4 Boundary and initial conditions
- 2.6.2.5 Implementation of the coal resource development pathway
- 2.6.2.6 Parameterisation
- 2.6.2.7 Observations and predictions
- 2.6.2.8 Uncertainty analysis
- 2.6.2.9 Limitations and conclusions
- Citation
- Acknowledgements
- Currency of scientific results
- Contributors to the Technical Programme
- About this technical product
