Section 2.6.2.8 provides a comprehensive description of the parameter combinations used for the uncertainty analysis and how these are derived from the initial values presented in Table 10. This section examines the effect of parameters on predictions in order to identify the most influential parameters.
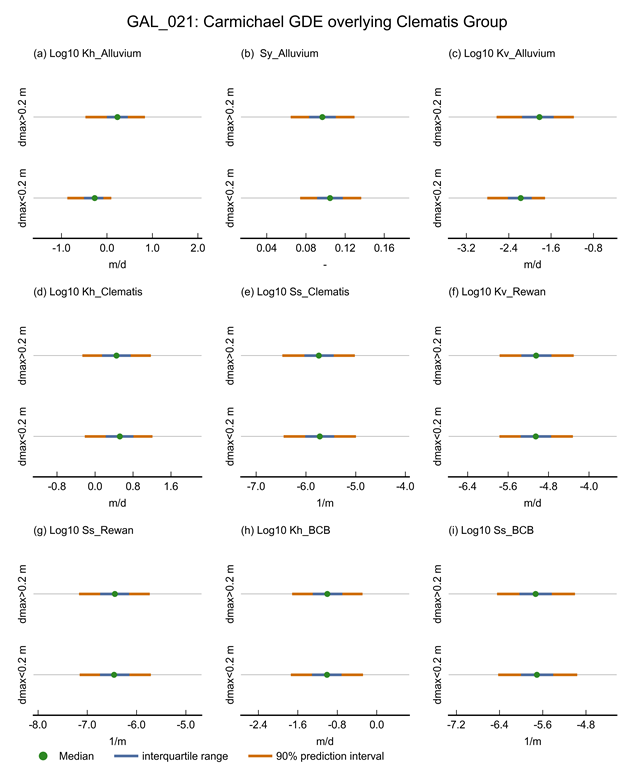
Each dot represents a model evaluation. The red lines indicate the median of the dmax values in the parameter range spanned by the red line segment.
dmax = maximum difference in drawdown between the coal resource development pathway (CRDP) and baseline, due to additional coal resource development
CRDP = baseline + additional coal resource development
Data: Bioregional Assessment Programme (Dataset 1)
Figure 12 shows the variation of the drawdown at model node GAL_021, the Carmichael groundwater-dependent ecosystem (GDE) overlying Clematis Group sediments, in the alluvium west of the Carmichael Coal Project in function of the GW AEM parameters. From this plot it is apparent that drawdown is mostly influenced by the hydraulic properties of the alluvium. The horizontal hydraulic conductivity appears to be the dominant parameter. This is a clear indication that the simulated drawdown at this model node is a propagation of the drawdown in the alluvium rather than a vertical propagation of the drawdown in the upper Permian coal measures via the Rewan Group aquitard (see Figure 9 and discussion in Section 2.6.2.3.2). Note that the propagation of drawdown from the Cenozoic and alluvium to the Clematis Group hinges on the assumption that the Cenozoic and alluvium are a continuous aquifer.
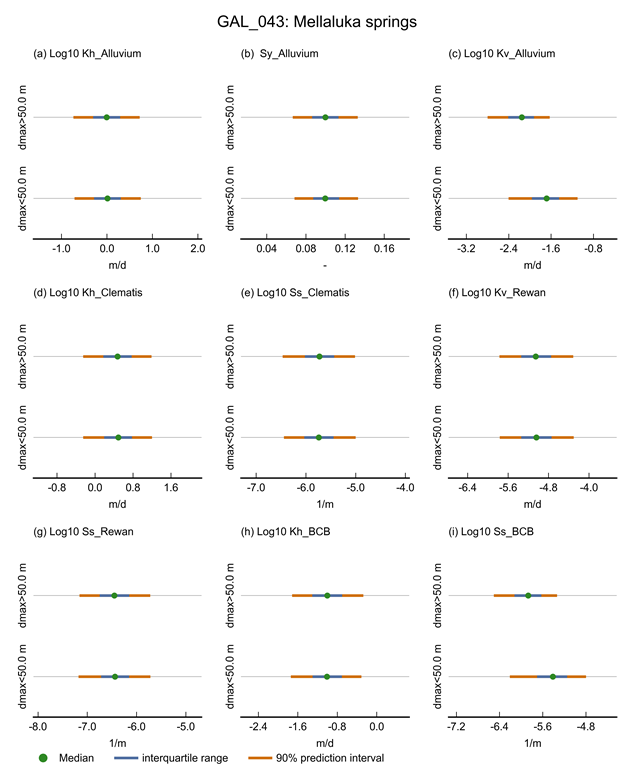
Figure 13 provides a similar plot for model node GAL_043, Mellaluka Springs. The dominant parameters affecting dmax are the vertical hydraulic conductivity of the alluvium and the specific storage of the upper Permian coal measures hydrostratigraphic unit. Lower storage values mean that for the same pumping rate more drawdown is realised. An increase in the vertical hydraulic conductivity of the alluvium allows for drawdown to be compensated by inflow from the Cenozoic and alluvium.
Each dot represents a model evaluation. The red lines indicate the median of the dmax values in the parameter range spanned by the red line segment.
dmax = maximum difference in drawdown between the coal resource development pathway (CRDP) and baseline, due to additional coal resource development
CRDP = baseline + additional coal resource development
Data: Bioregional Assessment Programme (Dataset 1)
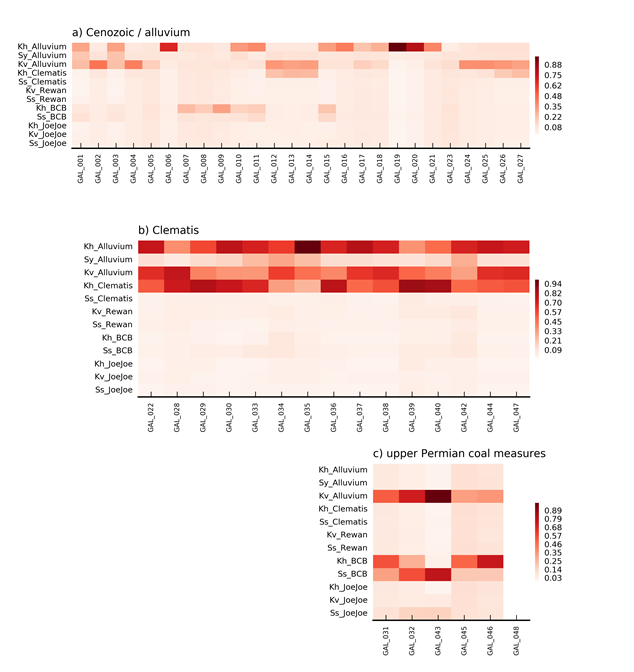
A similar graphical analysis of these relationships for each model node is beyond the scope of the product. Figure 14 shows the sensitivity index of dmax for each parameter–model node combination, calculated with the density-based sensitivity index introduced by Plischke et al. (2013). Larger values of the sensitivity index indicate higher sensitivity of the prediction to the parameter.
The colour scale represents the sensitivity index score where larger values represent higher sensitivity.
dmax = maximum difference in drawdown between the coal resource development pathway (CRDP) and baseline, due to additional coal resource development
CRDP = baseline + additional coal resource development
Data: Bioregional Assessment Programme (Dataset 1)
The sensitivity indices shown in Figure 14(c) for the upper Permian coal measures confirm the relationships identified in Figure 13; the dominant parameters are the hydraulic properties of the upper Permian coal measures and the vertical hydraulic conductivity of the Cenozoic aquitard. The hydraulic properties of the upper Permian coal measures control the propagation of the cone of depression into this formation, where low values of both parameters will lead to large drawdowns. In model nodes close to the mine footprints, drawdowns are most sensitive to storage, while further away from the mines, the horizontal hydraulic conductivity is more important.
The vertical hydraulic conductivity of the Cenozoic aquitard controls the interaction with the constant drawdown boundary representing the Belyando River. High values of this parameter allow for more water to compensate the drawdown in the upper Permian coal measures aquifer and therefore result in lower drawdowns. The Joe Joe Group aquifer has a similar effect on drawdowns in the upper Permian coal measures as high vertical hydraulic conductivity of the Joe Joe Group aquitard and specific storage of the Joe Joe Group aquifer result in more water compensating drawdowns and thus smaller drawdowns in the upper Permian coal measures.
The drawdown in the Cenozoic and alluvial aquifer (Figure 14(a)) is dominated by the horizontal hydraulic conductivity of the Cenozoic and alluvial aquifer, followed by the vertical hydraulic conductivity and specific yield. The hydraulic properties of the upper Permian coal measures aquifer appear to only noticeably affect drawdown predictions at model nodes GAL_007 to GAL_011 and GAL_015. These are all situated in the area where the upper Permian coal measures subcrop directly underneath the Cenozoic cover. These sensitivity indices are related to the two stresses imposed to the system at the mine footprints: the pumping rates in the upper Permian coal measures, and the constant drawdown in the Cenozoic aquifer. In the vicinity of the mine footprints, the effect of the constant drawdown dominates which makes the horizontal hydraulic conductivity and specific yield of the Cenozoic aquifer the most important parameters. Further away from the mines, the influence of the constant drawdown boundary diminishes. At these model nodes, the propagation of drawdown through the Cenozoic aquitard becomes more important. For those model nodes, the vertical hydraulic conductivity of the Cenozoic aquitard and the hydraulic properties of the upper Permian coal measures become more important.
Figure 14(b) shows the sensitivity of dmax at the model nodes associated with the Clematis Group aquifer. The dominant parameters are the hydraulic conductivity of the Clematis Group aquifer and the hydraulic properties of the Cenozoic aquifer and aquitard. It is noteworthy that the hydraulic properties of the upper Permian coal measures aquifer and Rewan Group aquitard do not appear to affect the predictions. This is an indication that, despite the range of vertical hydraulic conductivities sampled for the Rewan Group aquitard, there is limited direct influence from the depressurisation of the upper Permian coal measures on drawdowns in the Clematis Group aquifer. The drawdowns realised in the Clematis Group aquifer are therefore mostly controlled by propagation of drawdown from the overlying Cenozoic cover. It is again emphasised that the propagation of drawdown from the Cenozoic and alluvium to the Clematis Group hinges on the assumption that the Cenozoic and alluvium are a continuous aquifer.
The change in surface water – groundwater flux with the Belyando River is not a hydrological response variable of the groundwater model, but will be an important input to the surface water model (see companion product 2.6.1 for the Galilee subregion (Karim et al., 2018)).
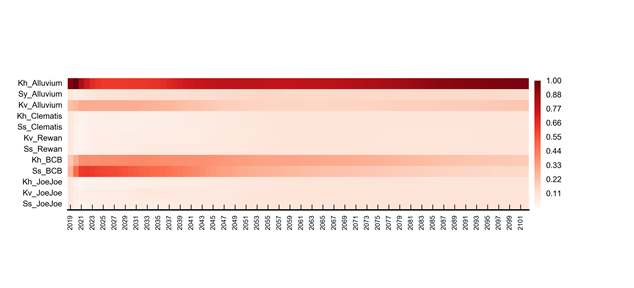
The colour scale represents the sensitivity index score where larger values represent higher sensitivity.
Data: Bioregional Assessment Programme (Dataset 1)
Figure 15 shows the sensitivity of the simulated surface water – groundwater flux for each year of simulation for all the segments of the Belyando River included in the GW AEM.
In the first two decades of coal resource development, the surface water – groundwater flux is controlled by the horizontal hydraulic conductivity of the Cenozoic aquifer and the specific storage of the upper Permian coal measures and to a lesser extent by the vertical hydraulic conductivity of the Cenozoic aquitard and the horizontal hydraulic conductivity of the upper Permian coal measures. As development continues, the sensitivity to both the storage of the upper Permian coal measures and the vertical hydraulic conductivity of the Cenozoic cover decreases, while sensitivity to the horizontal hydraulic conductivity of the upper Permian coal measures remains the same and sensitivity to the horizontal hydraulic conductivity of the Cenozoic cover increases.
These sensitivities reflect the transient nature of the coal resource development. In the first decades, most of the drawdown in the upper Permian coal measures is realised by depletion of the available storage. The drawdown is compensated by water coming from the Cenozoic aquifer, which is controlled by the Cenozoic aquitard conductivity. As the development continues, the drawdown is increasingly controlled by the ease with which water can be transferred through the upper Permian coal measures (i.e. the horizontal hydraulic conductivities). In the final stages of the simulation period, drawdowns in the upper Permian coal measures are recovering and the surface water – groundwater flux is controlled by the new equilibrium between the fixed drawdowns at the mine footprint and the Belyando River and thus the horizontal hydraulic conductivity of the Cenozoic aquifer.
Section 2.6.2.8 provides a more elaborate discussion on the spatial variation of predicted drawdown and year of maximum change.
Product Finalisation date
- 2.6.2.1 Methods
- 2.6.2.2 Review of existing models
- 2.6.2.2.1 Alpha and Kevin's Corner model review
- 2.6.2.2.2 Carmichael model review
- 2.6.2.2.3 China First model review
- 2.6.2.2.4 China Stone model review
- 2.6.2.2.5 South Galilee model review
- 2.6.2.2.6 Galilee Basin hydrogeological model review
- 2.6.2.2.7 Suitability of existing groundwater models
- References
- Datasets
- 2.6.2.3 Model development
- 2.6.2.4 Boundary and initial conditions
- 2.6.2.5 Implementation of the coal resource development pathway
- 2.6.2.6 Parameterisation
- 2.6.2.7 Observations and predictions
- 2.6.2.8 Uncertainty analysis
- 2.6.2.9 Limitations and conclusions
- Citation
- Acknowledgements
- Currency of scientific results
- Contributors to the Technical Programme
- About this technical product

