- Home
- Assessments
- Bioregional Assessment Program
- Galilee subregion
- 2.6.2 Groundwater numerical modelling for the Galilee subregion
- 2.6.2.3 Model development
- 2.6.2.3.2 Hydrogeological conceptual model
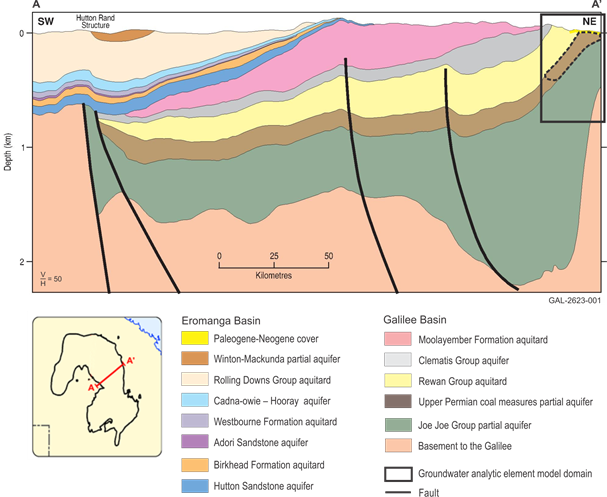
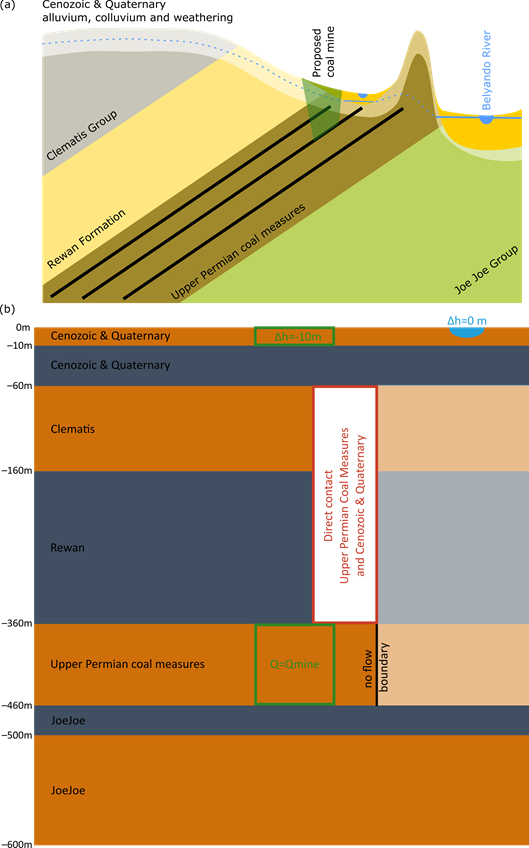
A detailed description of the hydrogeology of the Galilee subregion is provided in companion product 2.3 (Evans et al., 2018b). Figure 7 shows a geological cross-section of the Galilee Basin while Figure 9a shows a conceptual cross-section of the model domain.
The Galilee subregion is host to three groundwater systems, which generally operate independently but in some places are hydraulically connected. The three systems in order from youngest to oldest are:
The early Jurassic to late Cretaceous Eromanga Basin sequence constitutes most of the cover overlying the Galilee Basin (Figure 10 in companion product 2.1-2.2 for the Galilee subregion (Evans et al., 2018a)). The Eromanga Basin includes a significant portion of the layered aquifers and aquitards of the GAB. The boundary of the Eromanga Basin sequence occurs along the west of the Great Divide, approximately 25 to 55 km west of the nearest CRDP mines. The main aquifers of this sequence within the Galilee subregion are listed in order from youngest to oldest:
- The partial aquifer in the Winton-Mackunda formations partially outcrops over much of the western portion of the Galilee subregion and hosts a regional watertable groundwater flow system. This aquifer supplies a large number of shallow bores within the subregion. The Winton-Mackunda partial aquifer is separated from the underlying Hooray Sandstone aquifer by the Allaru Mudstone and Wallumbilla Formation, which form part of the regionally extensive Rolling Downs Group aquitard of the GAB. However, these units are locally considered a partial aquifer near their eastern boundary where they supply low-yielding shallow sub-artesian bores.
- The Hooray Sandstone and equivalents is the main artesian aquifer of the GAB and extends over the entire Galilee Basin from west of the Great Divide. Nearly half of the flowing artesian bores overlying the Galilee Basin are screened in this aquifer. The Hooray Sandstone is separated from the underlying Hutton Sandstone aquifer by the Injune Creek Group leaky aquitard.
- The Hutton Sandstone aquifer is a confined GAB-wide artesian aquifer, extending over the entire Galilee Basin from west of the Great Divide. The number of artesian bores screened in this aquifer is similar to that in the Hooray Sandstone aquifer, and accounts for nearly half of the flowing artesian bores overlying the Galilee Basin. The Hutton Sandstone aquifer directly overlies and is in contact with the upper unit of the Galilee Basin – the Moolayember Formation aquitard over most of the subregion.
- The Precipice Sandstone aquifer is the basal aquifer of the Eromanga Basin sequence. This aquifer is located in the south of the subregion, pinching out to the south of the CRDP mines. The Precipice Sandstone aquifer is separated from the Hutton Sandstone aquifer by the Evergreen Formation aquitard.
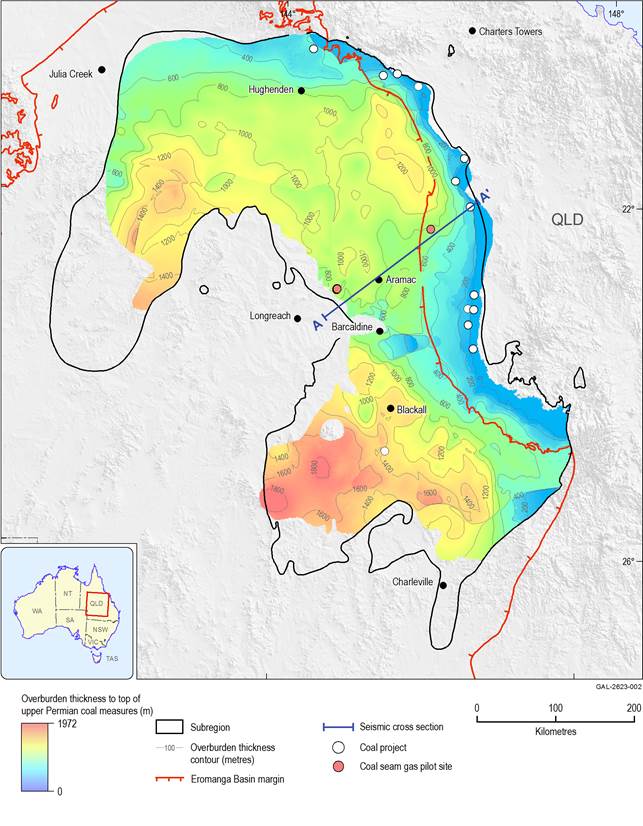
The edge of the Eromanga Basin coincides with the eastern outcrop extent of the Hutton Sandstone. Along this boundary, overburden thickness (strata lying above the upper Permian coal measures) is in the order of 400 to 600 m, in the vicinity of the southern CRDP mines, and reaches as much as 1000 m west of the northern CRDP mines (Figure 7 and Figure 8).
Paleogene-Neogene cover exaggerated; black dashes are a schematic representation of potential coal development
Data: Bioregional Assessment Programme (Dataset 1)
The upper sequence of the Galilee Basin groundwater system is the main focus of the groundwater model. The hydrogeology of the upper Galilee Basin is conceptualised as a series of alternating aquifers and aquitards, outcropping on the basin’s eastern boundary and gently dipping to the west. This sequence comprises the following aquifers, listed in order from youngest to oldest:
- The Clematis Group aquifer (includes Warang Sandstone in the north of the subregion) is the main regional aquifer in the Galilee Basin. This aquifer outcrops in some areas near CRDP mines. Recharge to the Clematis Group groundwater flow system is via rainfall in outcrop areas and leakage from underlying and overlying aquifers. The Clematis Group aquifer naturally discharges as baseflow to the Carmichael River and to the Doongmabulla Springs. The Moolayember Formation aquitard to a large extent separates the Clematis Group from the overlying GAB units across much of the basin, but is absent approaching the western margins of the Galilee Basin. Here the Hutton Sandstone aquifer is in direct contact with the Clematis Group aquifer (Figure 7).
- The upper Permian coal measures form a partial aquifer consisting of alternating layers of coal and porous sandstone. Coal seams within this unit are the target of mining operations, where they approach the surface, east of the Great Divide. There are seven named seams separated by interburden sandstones, ranging from the A seam in the Bandanna Formation at the top of the Betts Creek beds, to the F seam in the Colinlea Sandstone at the base, with the upper split in the D seam referred to as DU or D1, and the lower split called DL or D2. The coal seams are highly variable in thickness ranging from 0.1 m for the E seam at Kevin’s Corner to 18 m for the A seam at Carmichael (data from Bleakley et al., 2014). The mean thickness of the coal seams is about 3 m. The thickest total accumulation of coal occurs at Carmichael with a total thickness of 39 m; the thinnest accumulation is at South Galilee where the total coal thickness is considerably less (14.5 m). The interburden sandstones are thicker than the coal seams, with the thickest being the BC interburden. This unit ranges in thickness from 60 m at Carmichael to 90 m at Kevin’s Corner, Galilee and South Galilee (Bleakley et al., 2014). The coal seam most favoured by the mining companies is the D seam because of its low ash content. The Rewan Group separates the upper Permian coal measures from the overlying Clematis Group aquifer and forms a tight aquitard within the Galilee Basin sequence. Although the upper part of the Rewan Group (which is known as the Dunda beds) is generally regarded as more permeable than the rest of this unit (see companion product 2.1-2.2 (Evans et al., 2018a) for further details), the current lack of information about the regional extent and thickness of the Dunda beds meant that it could not be included as a specific unit within the groundwater model.
- The Joe Joe Group is the basal aquitard of the Galilee Basin, reaching in excess of 1000 m in thickness. This unit varies in hydraulic character, acting as a leaky aquitard in the north-eastern and central-eastern zone of the basin at the top of the sequence, due to the Aramac Coal Measures, and at the base of the sequence due to the Lake Galilee Sandstone. Elsewhere the unit is considered a tight aquitard.
The aquifers of the Eromanga and Galilee basins are unconformably overlain by a thin veneer of Cenozoic deposits which comprise Quaternary alluvial deposits, associated with streams, and older Cenozoic sediments. In some cases, these directly overlie the upper Permian coal measures. The potentiometric surface of the Cenozoic aquifers indicates that these sediments comprise a local groundwater flow system with a strong relationship with the surface drainage system of the major rivers, such as the Belyando River (see companion product 2.1-2.2 for the Galilee subregion (Evans et al., 2018a)).
As outlined in Section 2.3.2.1 in companion product 2.3 for the Galilee subregion (Evans et al., 2018b), the majority of rivers in the Galilee subregion have prolonged periods of low flow. During wet periods, river flows and flooding may recharge the alluvial aquifers. Groundwater stored in these aquifers may return to river baseflow or, if at shallow enough levels, be used as a water source for vegetation in riparian zones and on floodplains in dry periods. Groundwater discharging to rivers can prolong river flow during periods of low rainfall. Eventually, however, once groundwater levels fall below the base of the river channel, baseflow will cease.
Groundwater models are by necessity a simplification of the reality, designed to capture the salient features of the hydrogeological system relevant to the objectives of the modelling. The modelling for the BAs focuses on assessing the change to the groundwater system due to coal resource development rather than on reproducing and simulating the current and future state of the groundwater system (see submethodology M07 (as listed in Table 1) for groundwater modelling (Crosbie et al., 2016)). This allows the groundwater system to be simplified into the conceptual cross-section shown in Figure 9a, which subsequently is translated into an analytic element model (Figure 9b). The next section briefly introduces the main features of the implementation of the conceptual model into the groundwater model. The remainder of the product provides a more detailed discussion on the rationale and justification of these model choices.
In (b) aquifers are in dark orange, aquitards in dark grey. Green colours indicate stresses related to coal mining. Blue indicates surface water groundwater interaction. Q is the mine dewatering pumping rate. Δh is the change in groundwater level.
In the GW AEM, the hydrostratigraphy is implemented as an alternating sequence of aquifers and aquitards of infinite extent, constant thickness and uniform hydraulic properties. The details of the hydrostratigraphy as implemented in the model are provided in Section 2.6.2.3.5 and Table 11. The Cenozoic and alluvial cover is conceptualised to consist of a basal zone of low-permeability sediments, representing the Cenozoic weathering that resulted in a kaolinised weathering profile (see Section 1.1.3.2.3 in companion product 1.1 (Evans et al., 2014)) and an upper zone of highly permeable sediments representing unconsolidated colluvial and alluvial sediments.
The model excludes the early Jurassic to late Cretaceous Eromanga Basin sequence comprising the Hutton Sandstone and Hooray Sandstone and Winton-Mackunda Formation aquifers. The low-permeability Moolayember Formation separates the Eromanga Basin sequence from the Clematis Group aquifer. Any hydrological change in the Eromanga Basin sequence therefore will be smaller than the change simulated in the Clematis Group aquifer. This assumption of not simulating the change in the Eromanga Basin sequence is only justified if the simulated change in the Clematis Group aquifer is sufficiently small. The results presented in section 2.6.2.8.1 indicate that this is the case. Note that in the conceptualisation shown in Figure 9, hydraulic change in the layer representing the Clematis Group can occur via two pathways. Firstly, drawdown in the upper Permian coal measures can vertically propagate through the Rewan Group and result in drawdown in the Clematis Group. A second pathway is for drawdown in the Cenozoic and alluvial cover to propagate laterally and subsequently vertically propagate downwards into the Clematis Group.
At the eastern edge of the outcrop area of the upper Permian coal measures, a no-flow boundary is assigned. The location of this boundary is shown in Figure 10 (Section 2.6.2.4). Where the upper Permian coal measures subcrop under the Cenozoic and alluvial cover, a direct hydraulic connection between the upper Permian coal measures and the Cenozoic and alluvial cover is simulated (Figure 10 in Section 2.6.2.4), with a leakage proportional to the product of the vertical hydraulic conductivity of the Cenozoic sediments and the thickness of the kaolinised weathering profile. This thickness is nominally set to 50 m (see Section 2.6.2.3.5 and Table 11). This conceptualisation recognises that while locally there will be limited overburden covering the coal measures, there will always be an impedance to flow between coal measures and colluvial and alluvial sediments.
The pumping rates reported by mining companies (see companion product 2.3 for the Galilee subregion (Evans et al., 2018b)) are assigned to the mine footprints in the upper Permian coal measures. These pumping rates are based on local-scale modelling by the mining companies, which integrates greater local geological detail than available in the regional geological model (see companion product 2.1-2.2 for the Galilee subregion (Evans et al., 2018a)) and more detailed mine development plans. By applying these locally derived pumping rates, local detail and information can be integrated into the regional-scale model. In the Cenozoic aquifer, a constant drawdown of 10 m is assigned to the mine footprints. This drawdown represents the direct and complete dewatering of the Cenozoic and alluvial deposits with a nominal saturated thickness of 10 m. Further details on the implementation of the CRDP are provided in Section 2.6.2.5.
The potentiometric surface of the Cenozoic sediments indicates that the alluvial system of the Belyando River can be considered to be a regional discharge feature with groundwater levels underneath the Belyando River controlled by the local interaction between river stage and groundwater evaporation. The Belyando River channel is therefore assigned a constant drawdown of zero metres as the groundwater level underneath the Belyando River channel is unlikely to change due to coal mining activity. The location of this boundary is shown in Figure 10 in Section 2.6.2.4, and a more detailed discussion of the boundary and initial conditions is provided in Section 2.6.2.4 .

Product Finalisation date
- 2.6.2.1 Methods
- 2.6.2.2 Review of existing models
- 2.6.2.2.1 Alpha and Kevin's Corner model review
- 2.6.2.2.2 Carmichael model review
- 2.6.2.2.3 China First model review
- 2.6.2.2.4 China Stone model review
- 2.6.2.2.5 South Galilee model review
- 2.6.2.2.6 Galilee Basin hydrogeological model review
- 2.6.2.2.7 Suitability of existing groundwater models
- References
- Datasets
- 2.6.2.3 Model development
- 2.6.2.4 Boundary and initial conditions
- 2.6.2.5 Implementation of the coal resource development pathway
- 2.6.2.6 Parameterisation
- 2.6.2.7 Observations and predictions
- 2.6.2.8 Uncertainty analysis
- 2.6.2.9 Limitations and conclusions
- Citation
- Acknowledgements
- Currency of scientific results
- Contributors to the Technical Programme
- About this technical product


