2.1.3.1.1 Recharge
Groundwater recharge refers to surface water that moves to groundwater. It is not a water flux that is easy to measure and little observation data are available. Various methods are used to estimate recharge: some estimates are provided here for the Hunter subregion, but they are not strictly observations data.
The simplest method to estimate recharge is using a constant percentage of rainfall and to assume no other losses. Groundwater recharge is commonly a priori estimated at 2% of rainfall or less but with higher values in areas of higher regolith permeability (Mackie Environmental Research, 2006) as a first estimate. Assuming the 2% level applies uniformly across the subregion and using the subregion average rainfall of 793 mm, an estimate of the catchment average annual recharge of 15.9 mm is obtained.
The next level of complexity requires a spatially variable modelled estimate of recharge. A recharge surface has been generated for the Hunter subregion and Sydney Basin bioregion and is detailed in section 2.1.3.2. The recharge surface reflects the variability arising from lower rainfall conditions in the western parts of the catchment, compared to higher recharge in the sandy alluvial soils of the Hunter River and coastal dunes (see Figure 22). Estimates of mean annual recharge of 7.2 mm in the 7700 km2 Goulburn River basin and 9.0 mm for the 13,616 km2 of the subregion upstream of Greta (which includes the Goulburn River basin) were obtained from this gridded surface. Using a weighted difference by area, the mean annual recharge rate for the 5916 km2 containing the regulated Hunter River alluvium in the subregion is 11.4 mm, or around 1.5% of rainfall.
2.1.3.1.2 Regolith depth and alluvium extent
The alluvium and other near-surface (not more than about 10 m below surface) strata are where exchanges between groundwater and surface water occur. Characteristics of the near-surface zone differ from the deeper stratigraphy: the alluvium is often a significant source of fresh groundwater; non-alluvial near-surface areas are typically more weathered and have higher hydraulic conductivities than the underlying rocks; and near-surface zones may be only partially saturated. Another advantage of having a clear estimate of the extent of the alluvium and its hydrogeology is that this zone often supports many GDEs, both those with above-ground expression as well as subsurface ecosystems. These characteristics mean that an accurate representation of the near-surface zone is advantageous in a groundwater model.
Regolith depth data over Australia can be found in Wilford et al. (2015; CSIRO, Dataset 5). This dataset maps the depth of the regolith over Australia at a 3-second (~90 m) resolution. Figure 15 shows regolith depth for the Hunter subregion. Mean regolith depth is less than 4 m, although is significantly deeper in alluvial areas (up to 20 m) and coastal sand beds (up to 40 m). This dataset informs the thickness of the topmost layers within the groundwater model (see companion product 2.6.2 for the Hunter subregion (Herron et al., 2018)).
The spatial extent of the alluvium and coastal sands in the Hunter subregion is shown in Figure 16 (Bioregional Assessment Programme, Dataset 6). These data are derived from the Surface Geology of Australia 2012 edition (Geoscience Australia, Dataset 7), which is a seamless national coverage of outcrop surficial geology at or around the 1:1,000,000 scale.
In the groundwater model the depth of the alluvium is assumed equal to the depth of the regolith; therefore, Figure 15 and Figure 16 define the three-dimensional extent of the alluvium in the groundwater model. This is described further in companion product 2.6.2 for the Hunter subregion (Herron et al., 2018).
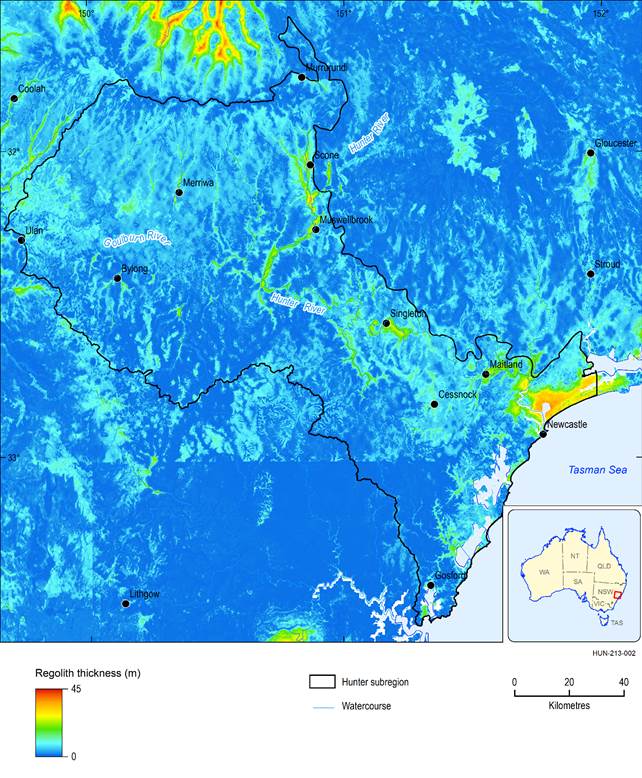
Figure 15 Depth of regolith over the Hunter subregion
Data: CSIRO (Dataset 5)
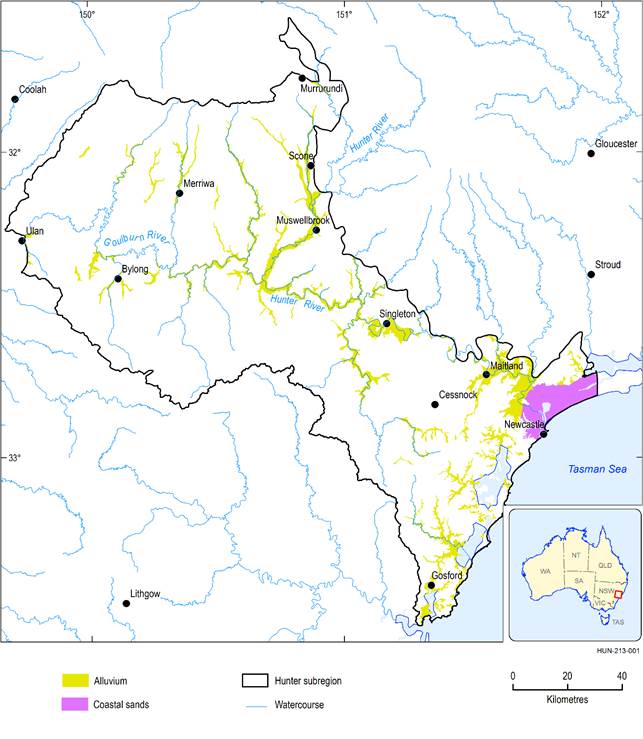
Figure 16 Spatial extent of the alluvium and coastal sands in the Hunter subregion
Note some areas of alluvium appear isolated from the stream network because not all streams are shown.
Data: Bioregional Assessment Programme (Dataset 6)
2.1.3.1.3 Observed depths to watertable
The Hydstra Groundwater Measurement (HYDMEAS) database (Bioregional Assessment Programme, Dataset 8) contains 6906 measurements of depth to watertable at 584 locations in the Hunter subregion. Measurements of watertable depth span the period 1902 to 2012, with depths ranging between –1 m (above ground surface) and 99 m (below ground surface). The NSW Office of Water (now DPI Water), who originally published these data, makes no claims as to the accuracy of the records. Note that depth to watertable is used here to include groundwater depth and depth to watertable because there is often insufficient information about the screening depths of bores within the database to differentiate between the two. A measurement of water level in a bore that is screened to a depth below the watertable will give a depth to groundwater; this is not necessarily the same as depth to watertable from an unscreened bore at the same location.
Figure 17 shows the frequency distribution of observations per bore. More than 25% of the bores (162) have only one measurement, while a further 55 bores have only two measurements. The median number of observations at a single point is 3. This dataset is used to constrain the parameters of groundwater model uncertainty analysis, however, given the poor quality of the dataset, it may not provide much constraint (see companion product 2.6.2 for the Hunter subregion (Herron et al., 2018)).
Bores with more frequent measurements are located around Muswellbrook, Singleton and Denman.
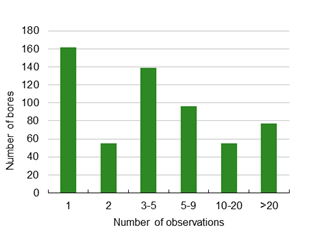
Data: Bioregional Assessment Programme (Dataset 8)
Figure 18 shows time series of depth to watertable at these locations which, in spite of the relative lack of recent measurements, suggest a consistent pattern of varying depth to watertable along the Hunter River valley, with deeper groundwater levels at Muswellbrook (around 12 m depth), shallowing around Denman to between 4 and 5 m depth, and then deepening again around Singleton (around 8 m depth).
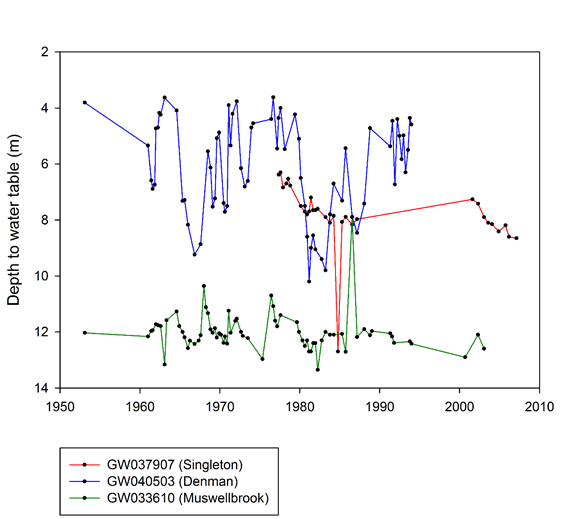
Figure 18 Observed depth to watertable at three locations within the Hunter subregion
Data: Bioregional Assessment Programme (Dataset 8)
Figure 19 shows mean depth to watertable for the 584 bores; however, as previously discussed, most of these mean depths are based on limited observations and take no account of when the measurements were taken.

Data: Bioregional Assessment Programme (Dataset 8)
